. 2025 Apr 28;22(1):124.
doi: 10.1186/s12985-025-02744-4.

Inhibition of ALKBH5 demethylase of m6A pathway potentiates HIV-1 reactivation from latency

Affiliations

Inhibition of ALKBH5 demethylase of m6A pathway potentiates HIV-1 reactivation from latency

Haider Ali et al. Virol J. .

Abstract

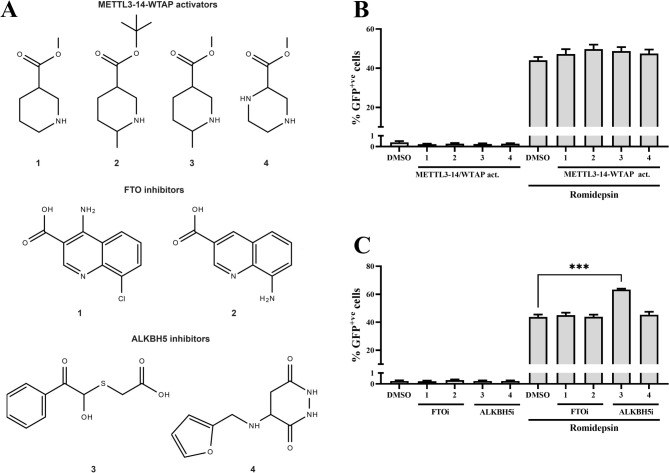
Background: Current latency-reversing agents (LRAs) employed in the "shock-and-kill" strategy primarily focus on relieving epigenetic and transcriptional blocks to reactivate the latent HIV-1. However, their clinical efficacy is limited, partly due to their inability to fully reverse latency and the lack of LRAs specifically targeting post-transcriptional mechanisms. N6-methyladenosine (m6A) modification in HIV-1 RNA is emerging as an important post-transcriptional regulator of HIV-1 gene expression, yet its role in latency and reactivation remains largely unrecognized. Here, we explored the potential of small chemical compounds targeting the m6A pathway, specifically investigating the inhibition of ALKBH5 and its effect on latent HIV-1 reactivation mediated by the LRA romidepsin.

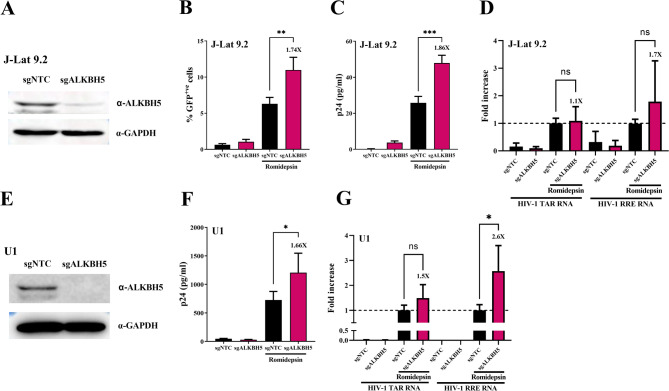
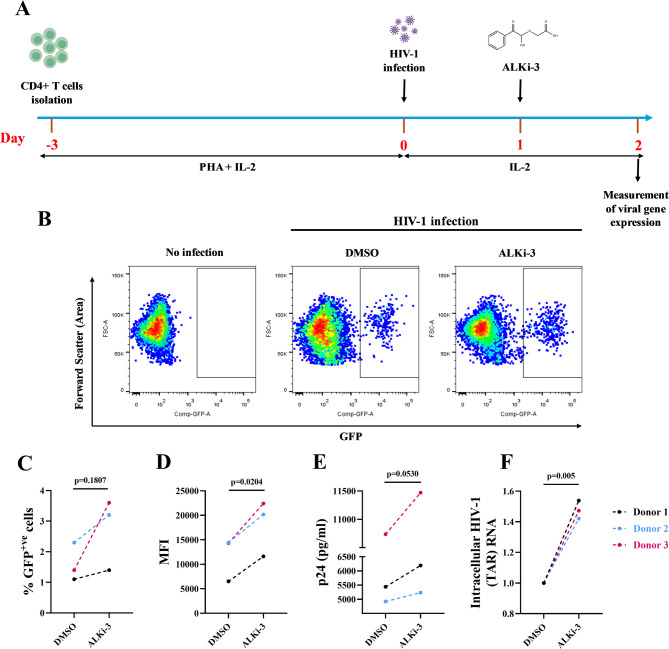
Methods: We used four in vitro cellular models of latency, primary model of CD4+ T cells HIV-1 infection and ex vivo cultures of CD8+-depleted PMBCs from ART-treated HIV+ patients. We measured latent viral reactivation by evaluating the expression of reporter protein GFP by flow cytometry, viral production by CA-p24 ELISA, and viral transcripts by RT-qPCR. CRISPR/Cas9 method was used to deplete ALKBH5. MeRIP and immuno-RNA FISH were used to address the m6A methylation levels on HIV-1 RNA upon ALKBH5 inhibition.

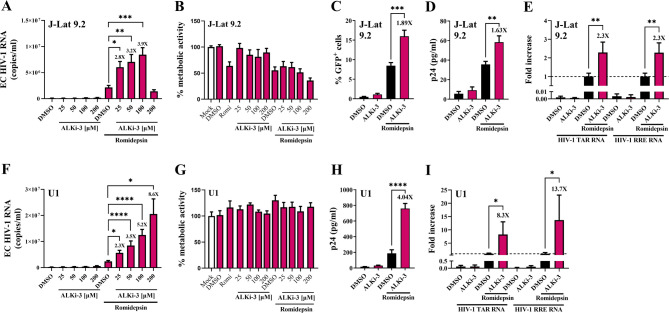
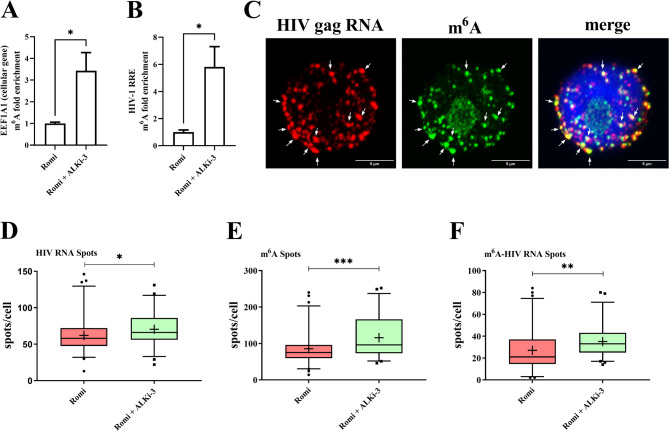
Results: We showed that ALKBH5 inhibitor 3 (ALKi-3) potentiated romidepsin-mediated viral reactivation in in vitro models of latency, primary model of CD4+ T cells infected with HIV-1 as well as in ex vivo cultures of CD8+-depleted PBMCs from ART-treated HIV+ patients. CRISPR/Cas9-mediated depletion of ALKBH5 mimicked the effects of ALKi-3. ALKi-3 increased levels of m6A-methylated HIV-1 RNA as shown by meRIP and immuno-RNA FISH.

Conclusion: Our study provides a proof-of-concept for the modulation of the m6A pathway in enhancing HIV-1 reactivation. This approach represents a promising adjunct to existing reactivation protocols and provides a concept of "dual-kick", aiming to target transcriptional and post-transcriptional steps in HIV-1 reactivation from latency.

Keywords: ALKBH5; Dual-kick; Epitranscriptomics; HIV-1; Latency; Post-transcriptional mechanisms; Shock-and-kill; m6A.


Conflict of interest statement

Declarations. Ethics approval and consent to participate: Ethical approval was granted by the Human Subject Ethics Committees of the Saint-Pierre Hospital (Brussels, Belgium). All individuals enrolled in the study provided written informed consent for donating blood. Consent for publication: Not applicable. Conflict of interest: A.O.P. received a research grant from Gilead Sciences Research Program. C.V.L. received a research grant from ViiV Healthcare. The funders had no role in study design, data collection and analysis, decision to publish, or preparation of the manuscript. The other authors declare no competing interests. Competing interests: The authors declare no competing interests.

Figures

Fig. 1
Fig. 1
ALKBH5 inhibitor 3 (ALKi-3) potentiates viral reactivation mediated by a sub-optimal dose of romidepsin. (A). Chemical structures of the METTL3-14-WTAP activators, FTO inhibitors, and ALKBH5 inhibitors. (B-C) J-Lat A2 cells were either DMSO-treated, treated with 100 µM of indicated compounds alone or in combination with romidepsin [5 nM]. At 24 h post-treatment, viral reactivation was assessed by flow cytometry to quantify the percentages of GFP+ cells. Means and standard error of means from three biological replicates in duplicates are indicated. Statistical analysis was performed using a paired Student’s t-test, p ≤ 0.0002 (***)
Fig. 2
Fig. 2
Enhanced reactivation potential of romidepsin by ALKi-3 in lymphoid J-Lat 9.2 and promonocytic U1 in vitro latency cellular models. (A-B, F-G) J-Lat 9.2 and U1 cells were either DMSO-treated, treated with increasing doses of ALKi-3 [25-50-100-200 µM] alone or in combination with sub-optimal dose of romidepsin (17.5 nM, and 5 nM for J-Lat 9.2 and U1 cells, respectively). At 24 h post-treatment (A, F) viral reactivation was assessed by measuring the concentration of genomic viral RNA copies/ml in culture supernatant using RT-qPCR. (B, G) Cells metabolic activity was measured by using XTT assay. Results obtained with the mock-treated cells were arbitrary set at a value of 100%. (C-E, H-I) Cells were treated with either DMSO (control), ALKi-3 alone (100 µM), or in a combination with suboptimal dose of romidepsin (17.5 nM, and 5 nM for J-Lat 9.2 and U1 cells, respectively). Viral reactivation was assessed 24 h post-treatment. (C) J-Lat 9.2 cells were subjected to flow cytometry analysis to quantify the percentages of GFP+ cells. (D, H) Viral production was estimated by measuring CA-p24 antigen in culture supernatant. (E, I) Total RNA was extracted that was subsequently subjected to quantification by RT-qPCR for TAR- and RRE-containing HIV-1 RNAs. Values were normalized using gapdh primers and were presented as relative fold changes to the values measured in romidepsin + DMSO-treated cells which were arbitrarily set at a value of 1. (A-I) Means and standard errors of the means from three biological repetitions in duplicates are represented. Statistical analysis was performed using a paired Student’s t-test with p-values indicating the significance level: p ≤ 0.05 (*), p ≤ 0.002 (**), p ≤ 0.0002 (***), and p ≤ 0.0001 (****)
Fig. 3
Fig. 3
Depletion of ALKBH5 potentiates viral reactivation in in vitro latency models. The J-Lat 9.2 (A-D) or U1 (E-G) cells were transduced with lentiviral vector targeting ALKBH5 (sgALKBH5) or with control sgRNA (sgNTC). Five days after puromycin selection, ALKBH5-depleted cells were harvested and subjected to romidepsin treatment for additional 24 h. (A, E) Immunoblotting to detect ALKBH5. GAPDH is the protein loading control. (B) J-Lat 9.2 cells were subjected to flow cytometry analysis to quantify the percentage of GFP+ cells. (C, F) Viral production was estimated by measuring CA-p24 antigen in culture supernatant. (D, G) Total RNA was extracted and subsequently subjected to quantification by RT-qPCR for TAR- and RRE-containing HIV-1 RNA. Values were normalized using gapdh primers and were presented as relative fold changes to the values measured in romidepsin treated sgNTC-transduced cells which were arbitrarily set at a value of 1. (B, C, F) Means and standard errors of the means from three biological repetitions in duplicates are represented. Statistical analysis was performed using a paired Student’s t-test with p-values indicating the significance level: p ≤ 0.05 (*), p ≤ 0.002 (**), p ≤ 0.0002 (***)
Fig. 4
Fig. 4
ALKi-3 treatment potentiates HIV-1 gene expression in primary CD4+ T model of HIV-1 infection. (A) Schematic of the experiment. CD4+ T cells were isolated and stimulated with 5 µg/ml of PHA-P and 20 units/ml of IL-2 for three days. At day three, CD4+ T cells were infected with HIV-1 NL4-3 ∆Env_EGFP and after 24 h of HIV-1 infection cells were treated with 50 µM of ALKi-3 for further 24 h and subjected to HIV-1 expression analyses. (B) Representative flow cytometry dot plot depicting no infection, and cells infected with HIV-1 NL4-3 ∆Env_EGFP either treated with DMSO or ALKi-3. CD4+ T cells were subjected to flow cytometry analysis to quantify the percentage of GFP+ cells (C) and their MFI (D). (E) Viral production was estimated by measuring CA-p24 antigen in culture supernatant. (C– E) Means and standard errors of the means from three donors are represented. Statistical analysis was performed using two-way ANOVA with p value indicated above the graph (F) Total RNA was extracted and subsequently subjected to quantification by RT-qPCR for TAR-containing HIV-1 RNA. Values were normalized using gapdh primers and were presented as relative fold changes to the values measured in DMSO-treated cells which were arbitrarily set at a value of 1. Means and standard errors of the means from three donors are represented. Statistical analysis was performed using a paired Student’s t-test with p value indicated above the graph
Fig. 5
Fig. 5
Impact of ALKi-3 on the levels of m6 A methylated HIV-1 RNA. U1 cells were treated either with romidepsin alone or with romidepsin + ALKi-3 and were collected 24 h post-treatment. (A-B) Total RNA was extracted and subsequently subjected to polyA mRNA enrichment followed by meRIP against m6A modified RNA. The m6A immunoprecipitated RNA was quantified by RT-qPCR for cellular EEF1A1- and RRE-containing HIV-1 RNAs. Values were normalized using input and IgG control and were presented as m6A fold enrichment. Means and standard errors of the means from three biological repetitions are represented. Statistical analysis was performed using a paired Student’s t-test with p-values indicating the significance level: p ≤ 0.05 (*), p ≤ 0.002 (**), p ≤ 0.0002 (***), and p ≤ 0.0001 (****). (C-F) Reactivated U1 cells were subjected to RNA-FISH and immunostaining using antibodies against m6A modification for subsequent confocal microscopy analysis. (C) Representative image of m6A immuno-HIV RNA FISH. HIV-1 gagRNA is shown in red, m6A in green, and DAPI-stained nucleus in blue. Yellow spots indicate colocalization sites as marked by white arrows. (D-F) The number of m6A (D), HIV-1 gagRNA (E) and m6A-HIV-1 gagRNA (F) spots were quantified. Images were acquired with confocal microscopy and spots were quantified in z-stacks from approx. 20 images/biological repetition, n = 3. Results are presented as box and whiskers with 5–95% confidence interval. Median value is shown as a bar, dots are spots outside the whiskers representing outliers, mean value is shown as “+”.Statistical analysis was performed using a paired Student’s t-test with p-values indicating the significance level: p ≥ 0.12 (not significant– ns), p ≤ 0.05 (*), p ≤ 0.002 (**), p ≤ 0.0002 (***), and p ≤ 0.0001 (****)

Similar articles

References

    1. Deeks SG, Lewin SR, Havlir DV. The end of AIDS: HIV infection as a chronic disease. Lancet. 2013;382:1525–33. - PMC - PubMed
    1. McMyn NF, Varriale J, Fray EJ, Zitzmann C, MacLeod H, Lai J, Singhal A, Moskovljevic M, Garcia MA, Lopez BM, Hariharan V, Rhodehouse K, Lynn K, Tebas P, Mounzer K, Montaner LJ, Benko E, Kovacs C, Hoh R, Simonetti FR, Laird GM, Deeks SG, Ribeiro RM, Perelson AS, Siliciano RF, Siliciano JM. The latent reservoir of inducible, infectious HIV-1 does not decrease despite decades of antiretroviral therapy. J Clin Invest. 2023;133:e171554. - PMC - PubMed
    1. Siliciano JD, Kajdas J, Finzi D, Quinn TC, Chadwick K, Margolick JB, Kovacs C, Gange SJ, Siliciano RF. Long-term follow-up studies confirm the stability of the latent reservoir for HIV-1 in resting CD4 + T cells. Nat Med. 2003;9:727–8. - PubMed
    1. Wong JK, Hezareh M, Günthard HF, Havlir DV, Ignacio CC, Spina CA, Richman DD. Recovery of Replication-Competent HIV despite prolonged suppression of plasma viremia. Science. 1997;278:1291–5. - PubMed
    1. Sadowski I, Hashemi FB. Strategies to eradicate HIV from infected patients: elimination of latent provirus reservoirs. Cell Mol Life Sci. 2019;76:3583–600. - PMC - PubMed

Publication types

MeSH terms

LinkOut - more resources