. 2025 May 15;228(10):jeb249948.
doi: 10.1242/jeb.249948. Epub 2025 May 23.

Temperature and precipitation explain variation in metabolic rate but not frequency of gas exchange in Fijian bees

Affiliations

Temperature and precipitation explain variation in metabolic rate but not frequency of gas exchange in Fijian bees

Carmen R B da Silva et al. J Exp Biol. .

Abstract

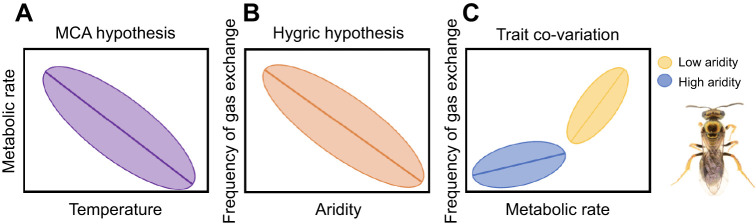
Temperature and water availability are hypothesised to be important drivers of the evolution of metabolic rate and gas exchange patterns, respectively. Specifically, the metabolic cold adaptation (MCA) hypothesis predicts that cold environments select for faster temperature-specific metabolic rates to counter the thermodynamics of biochemical reactions, while the hygric hypothesis predicts that dry environments select for discontinuous gas exchange to reduce water loss. Although these two hypotheses consider different physiological traits and how they vary along different abiotic gradients, metabolic rate drives the frequency of gas exchange in insects meaning these two traits are inherently linked. Despite this link, the MCA and hygric hypotheses are rarely considered together and the extent to which metabolic rates and frequency of gas exchange vary and co-vary across climatic gradients remains unclear. We tested the MCA and hygric hypotheses within a species of endemic Fijian bee, Homalictus fijiensis, and among four Fijian bee species across an altitudinal gradient of 1100 m (highlands are colder and wetter than lowlands). We found an MCA-like pattern within H. fijiensis and among Fijian bee species, where bees from colder environments had higher metabolic rates than bees from warmer environments when measured at 25°C, but precipitation also explained variation in metabolic rate. However, we did not find support for the hygric hypothesis within H. fijiensis or among species (frequency of gas exchange was not negatively correlated with precipitation). The relationship between metabolic rate and frequency of gas exchange was steeper for species that occupied lower elevations on average, suggesting it is possible that these two traits can evolve independently of each other despite being positively correlated.

Keywords: Discontinuous gas exchange; Evolutionary physiology; Functional traits; Hygric hypothesis; Krogh's rule; Metabolic cold adaptation; Respiration; Thermal performance; Tropical insects.


Conflict of interest statement

Competing interests The authors declare no competing or financial interests.

Figures

Fig. 1.
Fig. 1.
Abiotic variables across Viti Levu, Fiji. (A) Altitude (a.s.l., above sea level), (B) mean temperature of the coolest and driest month (July), (C) precipitation of the driest month (July) and (D) vapour pressure deficit (VPD) of the driest month (July). (E) Collection altitude of each species (Hf, Homalictus fijiensis; Bp, Braunsapis puangensis; Hg, Homalictus groomi; Ht, Homalictus tuiwawae) where circle size indicates the magnitude of the sample size. (F) Relationship between altitude and environmental temperature. (G) Relationship between altitude and precipitation. (H) Relationship between altitude and VPD. Filled circles indicate collection sites on the wet side of Viti Levu and open circles indicate sample sites on the dry side of Viti Levu.
Fig. 2.
Fig. 2.
Conceptual illustration of the relationship between traits and climate expected as per the metabolic cold adaptation hypothesis, hygric hypothesis and how traits might co-vary across an aridity gradient. (A) Relationship between metabolic rate and temperature if the metabolic cold adaptation (MCA) hypothesis is supported. (B) Relationship between frequency of gas exchange and aridity (inverse of precipitation or vapour pressure deficit, VPD) if the hygric hypothesis is supported. (C) Change in relationship between metabolic rate and frequency of gas exchange depending on aridity (precipitation or VPD). Where there is reduced selective pressure to avoid desiccation, we expect that selective pressure on metabolic rate and frequency of gas exchange will be relaxed, resulting in a steep relationship between metabolic rate and frequency of gas exchange in areas of high precipitation or low VPD. Homalictus fijiensis photo credit: James B. Dorey.
Fig. 3.
Fig. 3.
Residual metabolic rate across residual temperature and precipitation. (A,B) Residual metabolic rate (MR) of H. fijiensis (accounting for variation in body size) across residual average temperature of the coldest month (A) and residual precipitation of the driest month (B). (C,D) Residual metabolic rate of multiple Fijian bee species (accounting for variation in body mass) across residual temperature of the coldest month (C) and residual precipitation of the driest month (D). Note that residuals are presented for data visualisation purposes to highlight the effect of climatic variables on metabolic rate according to our models as per White et al. (2007); however, the raw data were analysed. Sample sizes: H. fijiensis n=125, B. puangensis n=44, H. groomi n=16, H. tuiwawae n=23.
Fig. 4.
Fig. 4.
Relationship between the frequency of gas exchange and metabolic rate within and among species. Frequency of gas exchange (min−1) against metabolic rate (ml min–1) within H. fijiensis (A) and among species (B). Sample sizes: H. fijiensis n=125, B. puangensis n=44, H. groomi n=16, H. tuiwawae n=23.
Fig. 5.
Fig. 5.
Slope of the relationship (accounting for body mass) between frequency of gas exchange and metabolic rate depending on the mean elevation that species were collected from. Circles are means, vertical error bars indicate the s.e.m. associated with each species slope, and horizontal error bars indicate the range of elevations that each species was collected across. R2=0.97. Sample sizes: H. fijiensis n=125, B. puangensis n=44, H. groomi n=16, H. tuiwawae n=23.

References

    1. Addo-Bediako, A., Chown, S. L. and Gaston, K. J. (2001). Revisiting water loss in insects: a large scale view. J. Insect Physiol. 47, 1377-1388. 10.1016/S0022-1910(01)00128-7 - DOI - PubMed
    1. Addo-Bediako, A., Chown, S. L. and Gaston, K. J. (2002). Metabolic cold adaptation in insects: a large-scale perspective. Funct. Ecol. 16, 332-338. 10.1046/j.1365-2435.2002.00634.x - DOI
    1. Alton, L. A., Condon, C., White, C. R. and Angilletta, M. J.Jr. (2017). Colder environments did not select for a faster metabolism during experimental evolution of Drosophila melanogaster. Evolution 71, 145-152. 10.1111/evo.13094 - DOI - PubMed
    1. Alton, L. A., Kutz, T., Bywater, C. L., Lombardi, E., Cockerell, F. E., Layh, S., Winwood-Smith, H., Arnold, P. A., Beaman, J. E., Walter, G. M.et al. (2024). Temperature and nutrition do not interact to shape the evolution of metabolic rate. Philos. Trans. R. Soc. B 379, 20220484. 10.1098/rstb.2022.0484 - DOI - PMC - PubMed
    1. Beekman, M. and Van Stratum, P. (1999). Respiration in bumblebee queens: effect of life phase on the discontinuous ventilation cycle. Entomol. Exp. Appl. 92, 295-298. 10.1046/j.1570-7458.1999.00550.x - DOI

Publication types

LinkOut - more resources