. 2025 May 19;166(7):bqaf083.
doi: 10.1210/endocr/bqaf083.

NPAS4 Depletion in POMC Neurons Protects From Obesity and Alters the Feeding-regulated Transcriptome in Male Mice

Affiliations

NPAS4 Depletion in POMC Neurons Protects From Obesity and Alters the Feeding-regulated Transcriptome in Male Mice

Ji Soo Yoon et al. Endocrinology. .

Abstract

Immediate early genes (IEGs), such as neuronal PAS domain protein 4 (Npas4), are induced as part of the response to environmental stimuli. In the arcuate nucleus (ARC), proopiomelanocortin (POMC) neurons are critical in detecting peripheral signals to regulate food intake. To date, Npas4 has not been studied in the context of regulating food intake, and its sites of action in the ARC are unknown. We found that Npas4 was induced in POMC neurons by refeeding, oral glucose, and a high-fat diet (HFD). In order to explore the role of NPAS4 in POMC neurons, a conditional knockout approach was used. Male mice with Npas4 knockout in POMC neurons showed significantly reduced body weight starting at 10 weeks of HFD, which was due to decreased food intake. Single-cell RNA sequencing on ARC cells demonstrated that POMC neurons of knockout mice showed an enhanced refeeding-induced transcriptional response, dysregulated IEG expression in response to refeeding, and reduced expression of genes encoding gamma-aminobutyric acid (GABA)-A receptor subunits. Cell-to-cell communication analysis revealed that POMC neurons of knockout mice lost inhibitory GABAergic signaling inputs and gained excitatory glutamatergic signaling inputs. Taken together, these results suggest that Npas4 tempers the activity of POMC neurons and loss of Npas4 causes impairments in nutrient intake sensing. Mechanistically, this results from reduced expression of inhibitory GABA-A receptors and an overall increase in the feeding-induced POMC neuron transcriptional response. In conclusion, we report a role for the transcription factor Npas4 in POMC neurons of the ARC and demonstrate its importance in controlling feeding behavior in states of overnutrition.

Keywords: POMC; arcuate nucleus; body weight; immediate early genes; obesity.


Figures

Figure 1.
Figure 1.
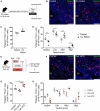
Npas4 is induced in POMC neurons by refeeding. (A) Schematic of brain harvests after fasting and refeeding. (B) Representative RNAscope images of sections from fasted and 1-hour refed mice, probed for Npas4 (green) and Pomc (red) mRNA, with DAPI nuclear stain (DNA; blue). Scale bars = 100 μm. (C) Quantifications of Npas4+ Pomc + cells as a percentage of total Pomc + cells from RNAscope images (B). (D) Breakdown of quantifications (C) into bins of Npas4 expression: Npas4- = 0 spots/cell, low = 1 to 3 spots/cell, med = 4 to 9 spots/cell, high = 10 or more spots/cell. Values are expressed as a percentage of Npas4+ Pomc + cells in all Pomc + cells. (E) Schematic of HFD brain harvest timeline. (F) Representative RNAscope images of sections from chow and 1-week HFD mice, probed in the same manner as (B). (G–H) Quantifications (G) and breakdown (H) of %Npas4+ Pomc + cells in RNAscope images (F), in the same manner as (C) and (D). Student's t-test (C–D): *P < .05. One-way ANOVA with Tukey's multiple comparisons (F–G): *P < .05, **P < .01, ***P < .001 vs chow. Abbreviations: DAPI, 4',6-diamidino-2-phenylindole; HFD, high-fat diet.
Figure 2.
Figure 2.
Recombination assessment of POMC-CreER mice. (A) Representative RNAscope images of the arcuate nucleus from POMC-CreER and POMC-NPAS4 KO mice, 0 days after tamoxifen administration, probed with Npas4 (green), Pomc (red), and DAPI nuclear stain (blue). (B) Quantifications of Npas4+ Pomc + cells in each genotype as a percentage of total Pomc + cells from RNAscope images (A). (C) Breakdown of quantifications (B) into bins of Npas4 expression levels: Npas4- = 0 spots/cell, low = 1 to 3 spots/cell, med = 4 to 9 spots/cell, high = 10 or more spots/cell. Data shown as mean + SD. Student's t-test: *P < .05. (D) Quantification of tdtomato + Pomc + cells in a POMC-CreER control as a percentage of total Pomc + cells from (E) RNAscope images probed with Npas4 (green), Pomc (white), and tdtomato (red) with DAPI nuclear stain (blue). Scale bars = 100 μm. Abbreviations: 3 V, third ventricle; DAPI, 4',6-diamidino-2-phenylindole; KO, knockout; POMC, proopiomelanocortin.
Figure 3.
Figure 3.
POMC-NPAS4 KO mice gain less body weight on HFD without differences in glycemia. (A) Schematic of experiments to characterize POMC-NPAS4 KO mice. (B) Biweekly overnight fasted blood glucose measurements for POMC-CreER (n = 9), Npas4 flox (n = 20), and POMC-NPAS4 KO (n = 19) mice during 30 weeks of HFD. (C) Random-fed and fasted body weights measured on alternating weeks during 30 weeks of HFD. (D-F) Blood glucose measurements during oral glucose tolerance tests at 5 weeks (D), 9 weeks (E), and 29 weeks (F) of HFD. (G-I) Plasma insulin measured at 0 and 10 minutes during oral glucose tolerance tests performed at 5 weeks (G), 9 weeks (H), and 29 weeks (I) of HFD. Two-way ANOVA with Tukey's multiple comparisons: *P < .05 (POMC-CreER vs POMC-NPAS4 KO), #P < .05 (POMC-CreER vs Npas4 flox), ^P < .05 (Npas4 flox vs POMC-NPAS4 KO). Abbreviations: HFD, high-fat diet; KO, knockout; POMC, proopiomelanocortin.
Figure 4.
Figure 4.
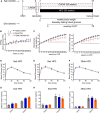
POMC-NPAS4 KO mice show reduced food intake in early weeks of HFD feeding. (A) Metabolic cage measurements of food intake (G) at 6 weeks HFD for POMC-CreER (n = 3), Npas4 flox (n = 2), and POMC-NPAS4 KO (n = 3) mice over 72 hours, shown as cumulative food intake and normalized percent cumulative food intake relative to Npas4 flox controls. One-way ANOVA with Tukey's multiple comparisons. (B) Body composition for all mice showing fat mass, lean mass, and total mass before metabolic cages. (C) Weekly body weight measurements over 2 weeks of HFD for POMC-CreER (n = 6) and POMC-NPAS4 KO (n = 6) mice. (D) Weekly manual food intake measurements over 2 weeks of HFD. (E) Quantifications of Npas4+ Pomc + cells from arcuate nucleus sections as a percentage of total Pomc + cells from RNAscope images. Brains were harvested after overnight fasting and 1-hour refeeding after 1 week of HFD. (F) Breakdown of quantifications (E) into bins of Npas4 expression levels: Npas4- = 0 spots/cell, low = 1 to 3 spots/cell, med = 4 to 9 spots/cell, and high = 10 or more spots/cell. (G) Quantifications of Npas4+ Pomc + cells from arcuate nucleus sections as a percentage of total Pomc + cells from RNAscope images. Brains were harvested after overnight fasting and 1-hour refeeding after 2 weeks of HFD. (H) Breakdown of quantifications (G) into bins of Npas4 expression levels as described in (F). Data in (E)–(H) shown as mean + SD. Student's t-test: *P < .05. Abbreviations: HFD, high-fat diet; KO, knockout; POMC, proopiomelanocortin.
Figure 5.
Figure 5.
scRNA-seq of mouse ARC cells to identify feeding-regulated genes and NPAS4-regulated genes at 6 weeks of HFD. (A) Overview of experimental design to generate single-cell libraries from POMC-CreER (CT; n = 3 fasted, n = 4 refed) and POMC-NPAS4 KO (KO; n = 3 fasted, n = 3 refed) mice at 6 weeks of HFD. (B) All cells integrated from all samples and projected in UMAP space, labeled by biological cell types. (C) Dot plot showing the average expression in each cluster for the top differentially expressed genes expressed in each cell type. Dot sizes represent percent of cells expressing a gene on the x-axis (“Percent Expressed”), and saturation represents expression levels in the cell type (“Average Expression”), with darker shades indicating higher average expression. Abbreviations: ARC, arcuate nucleus; HFD, high-fat diet; KO, POMC-NPAS4 KO; scRNA-seq, single-cell RNA sequencing.
Figure 6.
Figure 6.
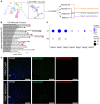
POMC neurons of 6-week HFD-fed POMC-NPAS4 KO mice have reduced GABA receptor subunit expression. (A) Schematic showing the analysis strategy used to identify DEGs between genotypes and conditions specifically in subsetted 1452 POMC neurons. DEG analysis was performed for pairs of different genotype and condition combinations to identify feeding-regulated genes and NPAS4-regulated genes. (B) Bar plots of the top 20 GO terms from GO library Molecular Function 2021 that are associated with genes downregulated in KO POMC neurons, in order of significance. Red arrows indicate terms associated with neurotransmitter signaling and neurotransmitter receptors. (C) Dot plot of significant DEGs enriched in CT vs KO Pomc + neurons encoding for GABA-A receptor subunits. The size of dots represents the percentage of cells in the genotype that express the gene (“Percent Expressed”), and the saturation represents the average expression of the gene on a normalized relative scale, with darker shades representing higher expression levels. (D) Representative images of 6-week HFD-fed POMC-CreER and POMC-NPAS4 KO mice, with tdTomato (red) marking POMC neurons in the arcuate nucleus and immunostained for GABA-A receptor β-3 subunit (green). Scale bars = 100 um. Abbreviations: 3 V, third ventricle; CT, POMC-CreER; DEG, differentially expressed gene; GABA, gamma-aminobutyric acid; GO, gene ontology; HFD, high-fat diet; KO, POMC-NPAS4 KO; POMC, proopiomelanocortin.
Figure 7.
Figure 7.
POMC neurons of POMC-NPAS4 KO mice have altered feeding-regulated gene expression and altered connectivity. (A) Venn diagram showing all 7 genes that are induced by refeeding in the CT POMC neurons are also induced by feeding in the KO POMC neurons. The identities of the 7 genes are shown in the black box to the right. (B) Violin plots showing expression of known immediate early genes that have significantly reduced expression in response to refeeding in POMC neurons of POMC-NPAS4 KO mice but not POMC-CreER controls. Wilcoxon rank-sum test: *Padjusted < .05. (C) Barplots comparing the weight of individual signaling interactions between CT and KO, restricted to signals coming from all neurons to POMC neurons. Significantly upregulated interactions in CT cells are labeled in black with asterisks, and significantly upregulated interactions in KO cells are labeled in orange with asterisks. Grey labels indicate interactions that were not significantly changed between CT and KO. (D-E) Circle plots for GABA_Gabra1 (D) and Glu_Grin2b (E) interactions between all senders to POMC neurons, with arrows indicating the communication and the significance of the interaction as the arrow's thickness. Abbreviations: CT, POMC-CreER; KO, POMC-NPAS4 KO; POMC, proopiomelanocortin.

Similar articles

References

    1. Sheng M, Greenberg ME. The regulation and function of c-fos and other immediate early genes in the nervous system. Neuron. 1990;4(4):477‐485. - PubMed
    1. Abraham WC, Dragunow M, Tate WP. The role of immediate early genes in the stabilization of long-term potentiation. Mol Neurobiol. 1991;5(2–4):297‐314. - PubMed
    1. Tyssowski KM, DeStefino NR, Cho JH, et al. Different neuronal activity patterns induce different gene expression programs. Neuron. 2018;98(3):530‐546.e11. - PMC - PubMed
    1. Lin Y, Bloodgood BL, Hauser JL, et al. Activity-dependent regulation of inhibitory synapse development by npas4. Nature. 2008;455(7217):1198‐1204. - PMC - PubMed
    1. Ramamoorthi K, Fropf R, Belfort GM, et al. Npas4 regulates a transcriptional program in CA3 required for contextual memory formation. Science. 2011;334(6063):1669‐1675. - PMC - PubMed

MeSH terms

Substances