. 2025 Apr 18;33(5):1217-1227.
doi: 10.32604/or.2025.059791. eCollection 2025.

Anticancer effects of SH003 and its active component Cucurbitacin D on oral cancer cell lines via modulation of EMT and cell viability

Affiliations

Anticancer effects of SH003 and its active component Cucurbitacin D on oral cancer cell lines via modulation of EMT and cell viability

Hyeong Sim Choi et al. Oncol Res. .

Abstract

Background: Oral cancer remains a significant global health challenge, as it has high morbidity and mortality rates. Current treatments show limited efficacy and have severe side effects, prompting searches for new therapeutic agents. SH003, a traditional herbal formulation comprising Astragalus membranaceus, Angelica gigas, and Trichosanthes kirilowii, has demonstrated potential anticancer properties in previous studies. However, its specific efficacy against oral cancer and the role of its key components, particularly Cucurbitacin D, remain underexplored.

Methods: The cytotoxic effects of SH003 and its major components-i.e., Cucurbitacin D, Decursin, Formononetin, and Nodakenin-were evaluated using 3-(4,5-Dimethylthiazol-2-yl)-2,5-Diphenyltetrazolium Bromide (MTT), Trypan Blue exclusion, and Lactate Dehydrogenase (LDH) release assays. Cell migration was analyzed via wound healing assays, and apoptosis induction was assessed using cell cycle analysis and caspase activation assays. Epithelial-to-mesenchymal transition (EMT) marker expression (E-cadherin and N-cadherin) was measured using Western blotting and Quantitative reverse transcription PCR (qRT-PCR).

Results: SH003 significantly reduced cell viability in a dose-dependent manner, with YD-8 and YD-9 cells showing greater sensitivity than YD-38 cells. Of the individual compounds, Cucurbitacin D was identified as a key active agent, as it exhibited potent inhibition of cell migration and significant modulation of EMT markers, including the upregulation of E-cadherin and downregulation of N-cadherin. These effects were most pronounced in YD-9 cells.

Conclusions: Taken together, these findings suggest that Cucurbitacin D plays a crucial role mediating the anticancer activity of SH003, particularly via the reversal of EMT and the reduction of migratory and invasive potential of oral cancer cells. This study provides valuable insight into the mechanistic basis of SH003, highlighting its potential as a therapeutic agent against oral cancer. Further research, including in vivo studies and clinical trials, is needed to elucidate its precise mechanisms and potential applications against other cancer types.

Keywords: Cucurbitacin D; Epithelial–mesenchymal transition (EMT); Migration; Oral cancer; SH003.


Conflict of interest statement

The authors declare no conflicts of interest to report regarding the present study.

Figures
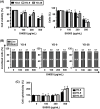
Figure 1
Figure 1. Effect of SH003 on cell viability and cytotoxicity in the YD-8, YD-9, and YD-38 oral cancer cell lines. (A) Left panel: cell viability of YD-8, YD-9, and YD-38 cells treated with increasing concentrations of SH003 (i.e., 0, 100, 200, 500 µg/mL) for 72 h. Viability was assessed using an MTT assay, and results are expressed as a percentage relative to untreated control cells. Right panel: Trypan Blue exclusion assay results showing reduced viable cell counts of YD-8, YD-9, and YD-38 cells treated with SH003 for 72 h, confirming dose-dependent cytotoxicity. (B) The proportion of living and dead cells following treatment with SH003, as assessed using live/dead cell assays, of YD-8, YD-9, and YD-38 cells, respectively. The data indicate a minimal increase in dead cells, even at 500 µg/mL, suggesting that SH003 reduces cell viability primarily through mechanisms other than direct cell death. (C) Cell cytotoxicity, as measured by LDH release after SH003 treatment for 15 h of YD-8, YD-9, and YD-38 cells. Data shown represent the mean ± SD of three independent experiments. *p < 0.05 compared to the untreated control. These results collectively demonstrate that SH003 decreases cell viability in a dose-dependent manner, with YD-8 and YD-9 cells exhibiting greater sensitivity to treatment than YD-38 cells.
Figure 2
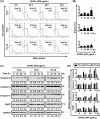
Figure 2. Impact of SH003 on the cell cycle and apoptosis induction in YD-8, YD-9, and YD-38 cell lines. (A) Cell cycle analysis of YD-8, YD-9, and YD-38 cells treated with SH003 (500 µg/mL) for 0, 24, 48, and 72 h. Flow cytometry was used to determine the percentage of cells in the sub-G1 phase. Representative histograms are shown for each cell line at different time points. (B) Quantification of the sub-G1 population from flow cytometry data. Results are presented as the percentage of sub-G1 cells at each time point (mean ± standard deviation; n = 3). (C) Western blot analysis showing the expression levels of apoptosis-related proteins (Caspase-9, Caspase-3, Caspase-7, and PARP) in YD-8, YD-9, and YD-38 cells treated with SH003 (500 µg/mL) for the indicated times. GAPDH was used as a loading control. (D) Quantification of Western blot results for apoptotic markers, showing fold changes relative to untreated controls (0 h). Data shown represent the results of three independent experiments. *p < 0.05 compared to an untreated control.
Figure 3
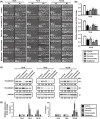
Figure 3. Inhibition of cell migration and EMT marker modulation following SH003 treatment in YD-8, YD-9, and YD-38 cell lines. (A) Wound healing assay showing reduced cell migration in YD-8, YD-9, and YD-38 cells treated with SH003 (500 µg/mL). Images were captured at 0 h and the indicated time points, with representative images shown for each treatment condition. (B) Quantification of wound healing assay results. The relative migration rate was measured using ImageJ software by analyzing the number of cells that migrated into the wound area. Results are expressed as fold change in migration relative to untreated control cells. White bars represent control groups, while black bars represent SH003-treated groups. (C) Western blot analysis of EMT markers (E-cadherin and N-cadherin protein levels) in YD-8, YD-9, and YD-38 cells following treatment with SH003 (500 µg/mL) for the indicated times. GAPDH was used as a loading control to normalize protein expression levels. (D) Quantification of Western blot results showing relative expression levels of EMT marker proteins. Data are presented as fold change relative to untreated control (0 h). (E) qRT-PCR analysis of EMT markers shows increased E-cadherin and decreased N-cadherin mRNA expression levels in YD-8, YD-9, and YD-38 cells treated with SH003 (500 µg/mL) for the indicated times. Results are normalized to GAPDH and expressed as fold change relative to the control group. All data represent the mean ± SD of three independent experiments. *p < 0.05 compared to the untreated control.
Figure 4
Figure 4. Identification of key active compounds in SH003 contributing to its effects on cell viability, migration inhibition, and EMT marker modulation. (A) MTT assay results showing the effects of various concentrations of Cucurbitacin D, Decursin, Formononetin, and Nodakenin on the viability of YD-8, YD-9, and YD-38 cells after 72 h of treatment. Curcurbitacin D exhibits the most potent inhibitory effect on cell viability across all tested cell lines. (B) Wound healing assay results showing the superior inhibitory effect of Cucurbitacin D (0.1 µM) on the migration of YD-8, YD-9, and YD-38 cells. Migration was assessed at 0 h and 6 or 8 h post-treatment, as indicated. Representative images highlight reduced wound closure in Cucurbitacin D-treated cells compared to untreated controls. (C) Quantification of wound healing assay results. The relative migration rate was measured using ImageJ software by analyzing the number of cells that migrated into the wound area. Data are expressed as fold change in migration relative to untreated control cells. White bars represent control groups, while black bars represent Cucurbitacin D-treated groups. (D) Western blot analysis of EMT-related protein levels, showing increased E-cadherin and decreased N-cadherin expression in YD-8, YD-9, and YD-38 cells treated with Cucurbitacin D (0.1 µM) for 24 h. GAPDH was used as a loading control. (E) Quantification of Western blot results showing relative expression levels of EMT marker proteins. Data are presented as fold change relative to untreated control. (F) qRT-PCR analysis confirming the upregulation of E-cadherin and downregulation of N-cadherin mRNA expression following treatment with Cucurbitacin D (0.1 µM) for 24 h, particularly in YD-9 cells. Data are normalized to GAPDH expression and presented as fold change relative to untreated controls. Data represent the mean ± SD of three independent experiments. *p < 0.05 compared to untreated control.
Figure A1
Figure A1. Identification of key active compounds in SH003 contributing to its effects on cell migration inhibition. (A) Wound healing assay showing the migration of YD-8, YD-9, and YD-38 cells treated with Cucurbitacin D (0.1 µM), Decursin (100 µM), Formononetin (100 µM), or Nodakenin (100 µM) at 0 h and 6 or 8 h post-treatment, as indicated. Representative images are shown for each treatment condition. (B) Quantification of wound healing assay results. The relative migration rate was measured using ImageJ software by analyzing the number of cells that migrated into the wound area. Data are presented as fold change in migration relative to untreated control cells. (C) Western blot analysis of EMT-related protein levels, including E-cadherin and N-cadherin, in YD-8, YD-9, and YD-38 cells treated with Cucurbitacin D (0.1 µM), Decursin (100 µM), Formononetin (100 µM), or Nodakenin (100 µM) for 24 h. GAPDH was used as a loading control. (D) Quantification of Western blot results showing relative expression levels of EMT marker proteins. Data are presented as fold change relative to untreated control. Data represent the mean ± SD of three independent experiments. *p < 0.05 compared to untreated control.

Similar articles

References

    1. Bray F, Laversanne M, Sung H, Ferlay J, Siegel RL, Soerjomataram I, et al. . Global cancer statistics 2022: GLOBOCAN estimates of incidence and mortality worldwide for 36 cancers in 185 countries. CA: A Cancer J Clinic. 2024;74(3):229–63. doi:10.3322/caac.21834; - DOI - PubMed
    1. Ribeiro-Rotta RF, Rosa EA, Milani V, Dias NR, Masterson D, da Silva EN, et al. . The cost of oral cancer: a systematic review. PLoS One. 2022;17(4):e0266346. doi:10.1371/journal.pone.0266346; - DOI - PMC - PubMed
    1. Nandini DB, Rao RS, Hosmani J, Khan S, Patil S, Awan KH. Novel therapies in the management of oral cancer: an update. Dis Mon. 2020;66:101036. doi:10.1016/j.disamonth.2020.101036; - DOI - PubMed
    1. Sonkin D, Thomas A, Teicher BA. Cancer treatments: past, present, and future. Cancer Genet. 2024;286–287:18–24. doi:10.1016/j.cancergen.2024.06.002; - DOI - PMC - PubMed
    1. Kubczak M, Szustka A, Rogalińska M. Molecular targets of natural compounds with anti-cancer properties. Int J Mol Sci. 2021;22(24):13659. doi:10.3390/ijms222413659; - DOI - PMC - PubMed

MeSH terms

LinkOut - more resources