

This is a preprint.
Measured intrapatient radiomic variability as a predictor of treatment response in multi-metastatic soft tissue sarcoma patients
- PMID: 40297462
- PMCID: PMC12036393
- DOI: 10.1101/2025.04.11.25325700
Measured intrapatient radiomic variability as a predictor of treatment response in multi-metastatic soft tissue sarcoma patients
Update in
-
Measured intrapatient radiomic variability as a predictor of treatment response in multi-metastatic soft tissue sarcoma patients.Sci Rep. 2025 Jul 30;15(1):27838. doi: 10.1038/s41598-025-12451-3. Sci Rep. 2025. PMID: 40739225 Free PMC article.
Abstract
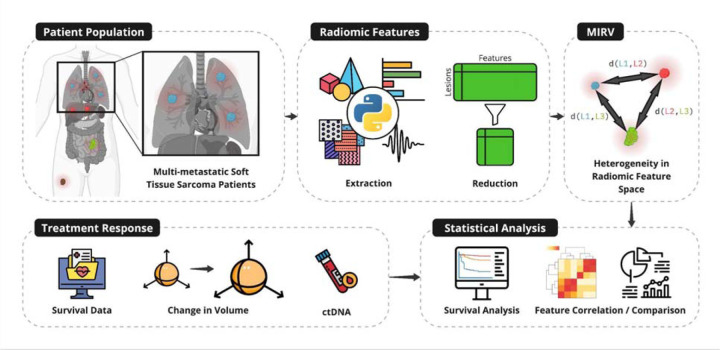
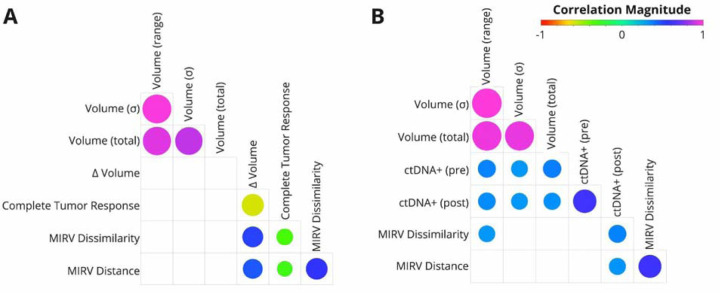
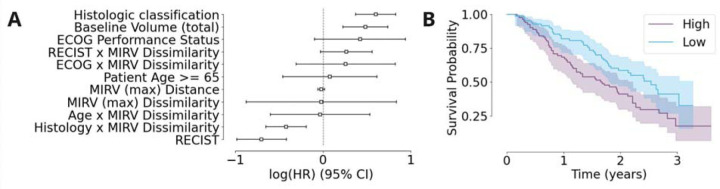
Radiomics offers a non-invasive approach to tumor characterization, yet its application in metastatic cancers is limited by intertumor heterogeneity-variability in radiomic phenotypes across lesions within the same patient. We introduce Measured Intrapatient Radiomic Variability (MIRV), a novel metric quantifying heterogeneity using standard-of-care imaging. Applied to 397 metastatic soft-tissue sarcoma (STS) patients from the SARC021 trial, MIRV was calculated from pretreatment CT scans using pairwise Euclidean distance and cosine dissimilarity between lesions. Euclidean distance captures absolute differences in radiomic features, while cosine dissimilarity assesses variation in feature patterns independent of magnitude. Higher MIRV correlated with greater variability in tumor-specific response classification (TSRC) and volumetric response, independent of baseline tumor volume. In a subset with liquid biopsy data, MIRV showed a moderate association with ctDNA positivity, suggesting links to molecular heterogeneity. While MIRV was not prognostic for overall survival (OS) in the full cohort, higher MIRV was significantly associated with worse survival in leiomyosarcoma patients (n=165, p=0.007). These findings establish MIRV as a biomarker for intertumor heterogeneity, with potential to predict mixed treatment responses and guide personalized therapy in metastatic STS. Future studies should assess its relevance across other tumor types and therapeutic settings.
Keywords: Tumor heterogeneity; liquid biopsy; radiomics; treatment response.
Figures
Similar articles
-
Measured intrapatient radiomic variability as a predictor of treatment response in multi-metastatic soft tissue sarcoma patients.Sci Rep. 2025 Jul 30;15(1):27838. doi: 10.1038/s41598-025-12451-3. Sci Rep. 2025. PMID: 40739225 Free PMC article.
-
Can a Liquid Biopsy Detect Circulating Tumor DNA With Low-passage Whole-genome Sequencing in Patients With a Sarcoma? A Pilot Evaluation.Clin Orthop Relat Res. 2025 Jan 1;483(1):39-48. doi: 10.1097/CORR.0000000000003161. Epub 2024 Jun 21. Clin Orthop Relat Res. 2025. PMID: 38905450
-
Patient-reported outcomes from the MIRASOL trial evaluating mirvetuximab soravtansine versus chemotherapy in patients with folate receptor α-positive, platinum-resistant ovarian cancer: a randomised, open-label, phase 3 trial.Lancet Oncol. 2025 Apr;26(4):503-515. doi: 10.1016/S1470-2045(25)00021-X. Lancet Oncol. 2025. PMID: 40179908 Clinical Trial.
-
Autologous hematopoietic stem cell transplantation following high dose chemotherapy for non-rhabdomyosarcoma soft tissue sarcomas.Cochrane Database Syst Rev. 2013 Aug 7;2013(8):CD008216. doi: 10.1002/14651858.CD008216.pub4. Cochrane Database Syst Rev. 2013. Update in: Cochrane Database Syst Rev. 2017 Apr 13;4:CD008216. doi: 10.1002/14651858.CD008216.pub5. PMID: 23925699 Free PMC article. Updated.
-
Systemic treatments for metastatic cutaneous melanoma.Cochrane Database Syst Rev. 2018 Feb 6;2(2):CD011123. doi: 10.1002/14651858.CD011123.pub2. Cochrane Database Syst Rev. 2018. PMID: 29405038 Free PMC article.
References
-
- Sun R, Lerousseau M, Briend-Diop J . Radiomics to evaluate interlesion heterogeneity and to predict lesion response and patient outcomes using a validated signature of CD8 cells in advanced …. for ImmunoTherapy of …. 2022. Available: https://jitc.bmj.com/content/10/10/e004867.abstract - PMC - PubMed
-
- Dagogo-Jack I, Shaw AT. Tumour heterogeneity and resistance to cancer therapies. Nat Rev Clin Oncol. 2018;15: 81–94. - PubMed
Publication types
Grants and funding
LinkOut - more resources
Full Text Sources