. 2025 Apr 14:13:1538197.
doi: 10.3389/fcell.2025.1538197. eCollection 2025.

The role of exosomal lncRNAs in mediating apoptosis and inflammation in UV-induced skin photoaging

Affiliations

The role of exosomal lncRNAs in mediating apoptosis and inflammation in UV-induced skin photoaging

Kunjie Li et al. Front Cell Dev Biol. .

Abstract

The skin, as the body's largest organ, functions as a vital barrier against environmental insults. Chronic exposure to ultraviolet (UV) radiation significantly contributes to premature aging, or photoaging, which leads to DNA damage and disrupts repair mechanisms. Exosomes, which are small extracellular vesicles, play a key role in cell-to-cell communication and might help mitigate the effects of photoaging by transporting bioactive molecules to skin cells. Long non-coding RNAs (lncRNAs) are increasingly recognized for their regulatory roles in the photoaging process, influencing stress responses and DNA repair; however, their involvement in exosomes in the context of skin aging is not yet well understood. In this study, we developed a photoaging model using SD rats subjected to UVA and UVB irradiation, which led to significant changes in the dermis such as increased dryness, wrinkles, pigmentation, and vascular alterations. Histological evaluations showed uneven thickening of the epidermis, degradation of collagen and elastic fibers, and cellular infiltration. Exosomes isolated from the dermal tissues exposed to UV radiation displayed altered size distributions. Transcriptomic analyses of the UV-treated rats identified 2,332 lncRNAs and 5,906 mRNAs that were differentially expressed, revealing significant involvement in pathways related to oxidative stress, apoptosis, and cellular stress responses. A cis-regulatory analysis identified 1,327 essential interactions between lncRNAs and mRNAs, highlighting their role in controlling inflammation and apoptosis. Importantly, both IL-1B and GADD45B levels were significantly increased in the exosomes and UV-challenged HaCaT cells, indicating their crucial roles in responding to UV-induced stress. This study highlights the significant role of exosomal lncRNAs in managing cellular reactions to UV-induced stress, impacting regulatory pathways associated with apoptosis, inflammation, and oxidative stress. These insights pave the way for the development of lncRNA-focused therapeutic approaches to address UV-induced skin damage.

Keywords: cis-regulatory; exosome; lncRNA; rat; skin photoaging.


Conflict of interest statement

The authors declare that the research was conducted in the absence of any commercial or financial relationships that could be construed as a potential conflict of interest.

Figures
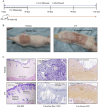
FIGURE 1
FIGURE 1
Development of the rat skin photoaging model and histological changes in photoaged rat skin. (A) Timeline illustrating the progression of the skin photoaging model. (B) General observations of rat skin in control and UV-exposed groups, highlighting photoaging effects. The control group (Normal) shows healthy skin with an intact surface and uniform pigmentation, while the UV-exposed group exhibits pronounced erythema, scaling, and rough texture, indicative of photoaging. (C) Histological changes in control and UV-damaged rat skin on day 120, as observed with hematoxylin and eosin (HE), toluidine blue, and Van Gieson staining. In the control group (Normal), HE staining (×40) reveals a well-organized epidermal layer, dermal layer, and muscular layer with regular elastic fiber arrangement (toluidine blue, ×100) and normal collagen fiber arrangement (Van Gieson, ×40). In the UV-exposed group, HE staining (×40) shows epidermal hyperplasia, inflammatory cell infiltration, disorders of collagen fiber arrangement, and an intact muscular layer. Toluidine blue staining (×100) highlights elastic fiber rupture and twisting, while Van Gieson staining (×40) confirms disordered collagen fiber arrangement. Scale bars are provided in each image: ×40 images indicate 300 μm, while ×100 images indicate 100 μm. Abbreviations: HE, Hematoxylin and Eosin; UV, Ultraviolet.
FIGURE 2
FIGURE 2
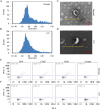
Characterization of exosomes from rat skin. (A, B) Quantification and size distribution of exosomes analyzed by nanoparticle tracking analysis (NTA). (C, D) Representative transmission electron microscopy (TEM) images of exosomes isolated from skin tissue. In the control group (Normal), panel (C) shows intact exosomes with a typically round morphology, displaying a characteristic ring-like structure with a diameter of approximately 100 nm (scale bar: 100 nm). In the UV-exposed group, panel (D) reveals exosomes that vary in size and are partially distorted, exhibiting irregular shapes and heterogeneous internal density, indicative of UV-induced morphological changes (scale bar: 100 nm). (E, F) Representative plots of CD9, CD63, and CD81 on individual exosomes were assessed using FITC and PE-conjugated antibodies via nano flow cytometry (NanoFCM analysis). Bivariate dot plots depict fluorescence intensity versus side scatter (SS-A).
FIGURE 3
FIGURE 3
Differential gene expression, functional enrichment, and kegg pathway analysis between uv-induced and control groups. (A) Volcano plot illustrating differentially expressed genes between the UV-induced and control groups. Red dots indicate high significance, while blue dots indicate low significance. (B) GO enrichment analysis of differentially expressed genes. The y-axis represents GO terms, and the x-axis represents -log10 FDR. (C) KEGG Pathway enrichment analysis of differentially expressed genes. The x-axis represents -log10 FDR, and the y-axis denotes KEGG pathway terms. (D) The heatmap reveals that several genes, particularly IL-1β, TNF-α, and IL6, exhibit marked upregulation under UV exposure conditions.
FIGURE 4
FIGURE 4
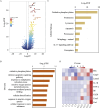
Differential expression analysis of cis-regulated target genes by lncrnas in exosomes from UV-induced and control groups. (A) Volcano plot depicting differentially expressed lncRNAs between the UV-induced and control groups. Red dots indicate high significance, and blue dots indicate low significance. (B) GO enrichment analysis of 2,336 differentially expressed genes cis-regulated by lncRNAs. The x-axis represents the enrichment factor, defined as the ratio of differentially expressed genes to all genes annotated to the GO terms. Purple indicates higher significance. The y-axis represents GO terms. (C) KEGG enrichment analysis of 2,336 differentially expressed genes cis-regulated by lncRNAs. The x-axis represents -log10 FDR, and the y-axis denotes KEGG pathway terms. (D) Trends in lncRNA and gene expression changes involved in apoptosis following UV-induction.
FIGURE 5
FIGURE 5
RT-PCR and Western blot analysis of Il1b and Gadd45a mRNA and protein levels in HaCaT cells. Following siRNA-mediated silencing and overexpression of Il1b and Gadd45a in HaCaT cells, mRNA and protein expression levels of both genes were assessed UV-induction using RT-PCR and Western blot analysis. (A, B) mRNA expression analysis. (C, D) Protein expression analysis. * P-value < 0.05, ** P-value < 0.01, *** P-value < 0.001.
FIGURE 6
FIGURE 6
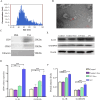
Exosome characterization and transmission of UV-induced IL-1β and GADD45B expression Changes in HaCaT Cells. (A) Particle size distribution of exosomes isolated from HaCaT cells, determined by nanoparticle tracking analysis. (B) Representative TEM image of exosomes, revealing characteristic cup-shaped vesicles (indicated by a red arrow). Scale bar = 100 nm. (C) Exosome-enriched protein markers. Including CD9 (25 kDa) and CD63 (53 kDa). And a neaative marker. Calnexin (90 kD) were analyzed by Western blot. (D) Relative mRNA expression levels of IL-1β and GADD45B were assessed by RT-qPCR in recipient HaCaT cells from four experimental groups, namely, untreated control, Control-Exo (treated with exosomes from untreated cells), UV-Exo (treated with exosomes from UV-irradiated cells), and direct UV exposure. (E) Western blot analysis of IL-1β and GADD45B protein levels in the same experimental groups, with β-actin as a loading control. (F) Quantification of relative IL-1β and GADD45B protein levels, normalized to the control group. * P-value < 0.05, ** P-value < 0.01, *** P-value < 0.001.
FIGURE 7
FIGURE 7
Effects of UV-Exo and direct UV exposure on apoptosis and inflammation in HaCaT cells. (A) Relative mRNA expression levels of Bcl-2, Caspase 3, and p53 in HaCaT cells across four groups: Control, Control-Exo, UV-Exo, and UV. Data were assessed by RT-PCR. (B) Western blot analysis of Bcl-2, Caspase 3, and p53 protein levels in HaCaT cells from the four experimental groups: Control, Control-Exo, UV-Exo, and UV. β-actin serves as the loading control. (C) Relative protein levels of Bcl-2, Caspase 3, and p53 in HaCaT cells across the four groups, quantified by densitometry and normalized to β-actin. (D) Concentrations of inflammatory cytokines (IFN-γ, GADFβ, TNF-α, IL-6, IL-1β) in culture supernatants of HaCaT cells from the four groups, measured by ELISA. * P-value < 0.05, ** P-value < 0.01, *** P-value < 0.001.

References

    1. Abel F., Murke F., Gaida M., Garnier N., Ochsenfarth C., Theiss C., et al. (2020). Extracellular vesicles isolated from patients undergoing remote ischemic preconditioning decrease hypoxia-evoked apoptosis of cardiomyoblasts after isoflurane but not propofol exposure. PLoS One 15, e0228948. 10.1371/journal.pone.0228948 - DOI - PMC - PubMed
    1. Beltrami C., Besnier M., Shantikumar S., Shearn A. I., Rajakaruna C., Laftah A., et al. (2017). Human pericardial fluid contains exosomes enriched with cardiovascular-expressed MicroRNAs and promotes therapeutic angiogenesis. Mol. Ther. 25, 679–693. 10.1016/j.ymthe.2016.12.022 - DOI - PMC - PubMed
    1. Cheng L., Hill A. F. (2022). Therapeutically harnessing extracellular vesicles. Nat. Rev. Drug Discov. 21, 379–399. 10.1038/s41573-022-00410-w - DOI - PubMed
    1. D'mello S. A., Finlay G. J., Baguley B. C., Askarian-Amiri M. E. (2016). Signaling pathways in melanogenesis. Int. J. Mol. Sci. 17, 1144. 10.3390/ijms17071144 - DOI - PMC - PubMed
    1. Dobin A., Davis C. A., Schlesinger F., Drenkow J., Zaleski C., Jha S., et al. (2013). STAR: ultrafast universal RNA-seq aligner. Bioinformatics 29, 15–21. 10.1093/bioinformatics/bts635 - DOI - PMC - PubMed

LinkOut - more resources