[Preprint]. 2025 Apr 11:rs.3.rs-6365283.
doi: 10.21203/rs.3.rs-6365283/v1.

IL-9 and Blimp-1 protects the transcriptional identity of group 2 innate lymphocytes in allergic asthma

Affiliations

IL-9 and Blimp-1 protects the transcriptional identity of group 2 innate lymphocytes in allergic asthma

Yibo Zheng et al. Res Sq. .

Abstract

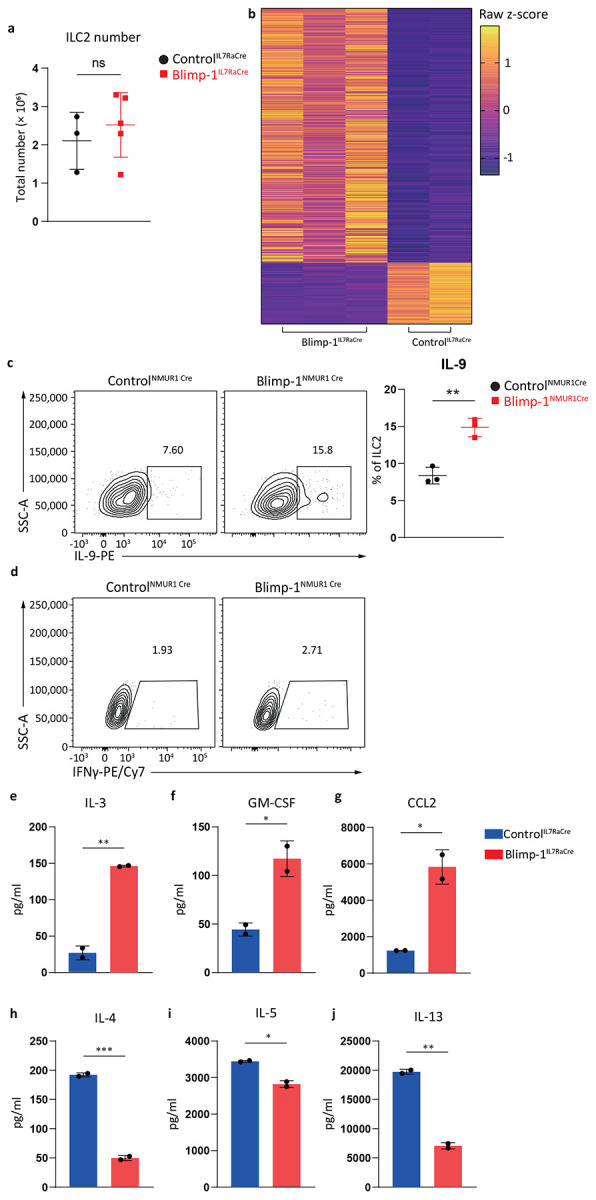
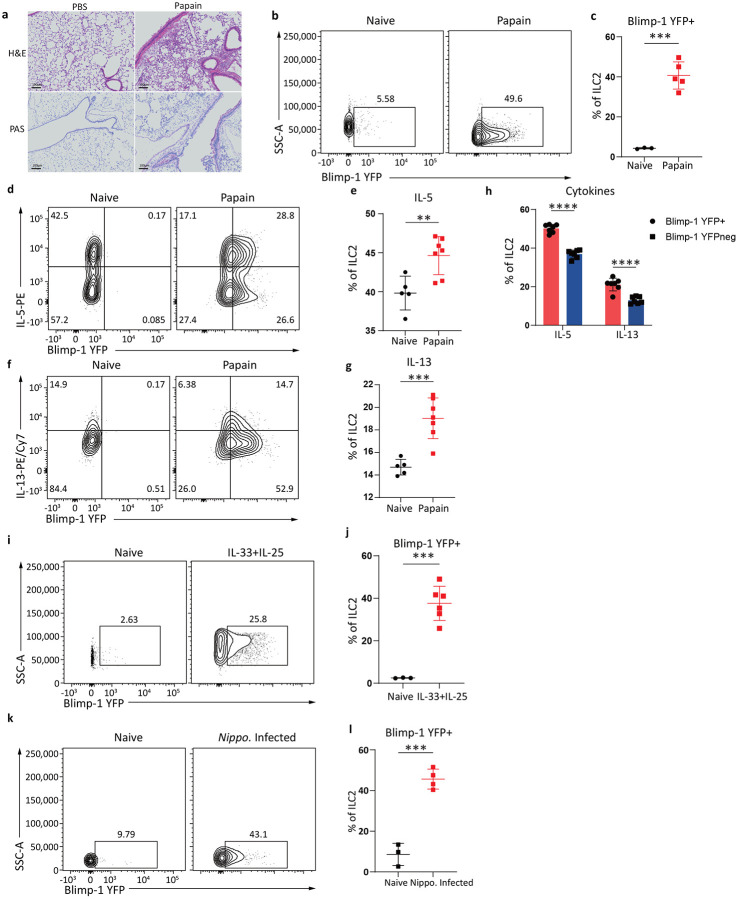
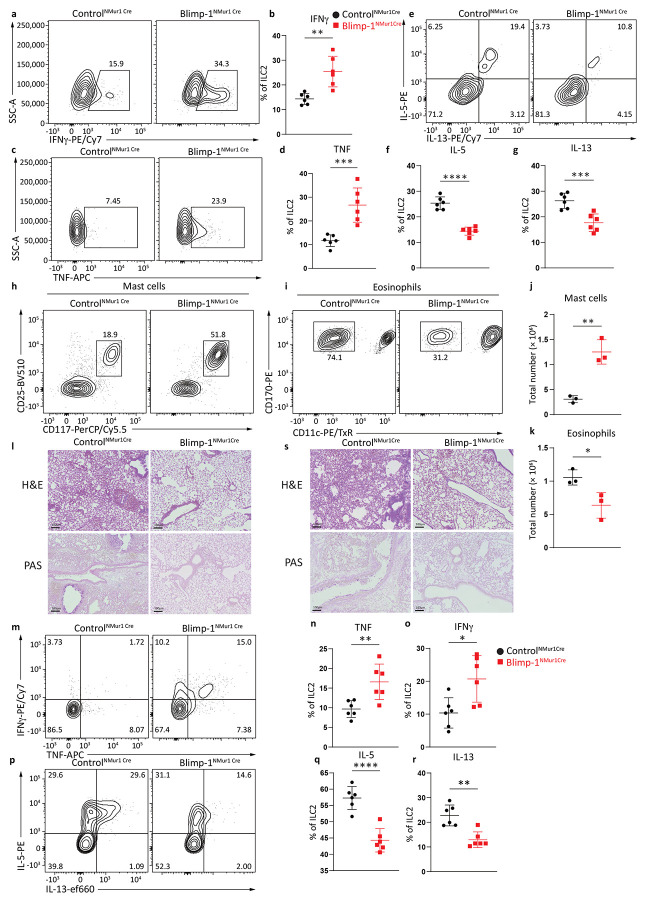
Allergic asthma is driven by type 2 immune cells including type 2 innate lymphoid cells (ILC2s). ILC2s respond to the tissue alarmins IL-33 and IL-25, however these signals do not uniquely promote type 2 inflammation, and the factors that maintain ILC2s ability to produce type 2 cytokines are not known. Here, we show that allergen-driven tissue alarmins IL-33 and IL-25 rapidly induce IL-9, which directly upregulates the transcriptional repressor Blimp-1 through an autocrine/paracrine mechanism. Blimp-1 promotes type 2 responses by directly repressing type 1 inflammation including the cytokines IFNγ and TNF. Deletion of Blimp-1 in ILC2s increases type 1 cytokines and concomitantly reduces type 2 cytokines, ameliorating mucus production and airway inflammation in response to allergens. Thus, Blimp-1 maintains the type 2 transcriptional identity of ILC2s in response to inflammation, driving type 2 immunity and allergic asthma.


Figures

Extended Data Fig. 1:
Extended Data Fig. 1:. Papain drives lung inflammation and activates ILC2s to express Blimp-1.
a, Schematic for papain induced asthma model. b-e, Gating strategy for eosinophils (c), cDC1s (d), cDC2s and MoDCs (e). f, Quantification of eosinophil percentage, eosinophil number and MoDC number in BAL after papain. g, Gating strategy for ILC2s. Each point represents one individual sample. The data are shown as means ± s.d., and present two or three independent experiments. A two-tailed unpaired t test was performed for f. *P < 0.05, **P < 0.01, ***P < 0.001. The specific P values are as follows for f: comparison between eosinophil percentage, P = 0.0003; comparison between total eosinophils, P = 0.0012; for E, P = 0.0323.
Extended Data Fig. 2:
Extended Data Fig. 2:. HDM drives lung inflammation and activates ILC2s to express Blimp-1 with a time dependent manner.
a, Schematic for HDM driven asthma model. b, Representative H&E staining after HDM. c, Percentage of Blimp-1 YFP in ILC2s at indicated timepoints by HDM model. d-e, Blimp-1 co-expression with IL-5 or IL-13 (d), or IL-5 and IL-13 co-expression (e) after HDM. f, Quantification of (e). g and j, Percentage of ILC2s in the lung (g) and Blimp-1 YFP in ILC2s (j) after FTY720 treatment. h-i and k-l, Quantification of CLP in bone marrow (h), ILC2s number in lung (i), Blimp-1 YFP+ ILC2s number (k) and percentage of Blimp-1 YFP+ ILC2s (l). m, Percentage of ILC2s from mesenteric lymph nodes with IL-33&25 i.p.. n, Percentage of Blimp-1 YFP in ILC2s from skin draining lymph nodes after IL-33&25 s.c..o, Quantification of (n). Each point represents one individual sample. The data are shown as means ± s.d., and present two or three independent experiments. A two-tailed unpaired t test was performed for h, i, k, l and o. Šídák's multiple comparisons test was performed for f. *P < 0.05, **P < 0.01, ***P < 0.001, ****P < 0.0001. The specific P values are as follows: for f, comparison between IL-5, P < 0.0001, comparison between IL-13, P = 0.0255; for h, P = 0.0004; for i, P = 0.0012; for k, P = 0.0149; for l, P = 0.9245; for o, P = 0.001.
Extended Data Fig. 3:
Extended Data Fig. 3:. Blimp-1 can be induced in gut and skin ILC2s in vitro.
a, Percentage of Blimp-1 YFP in dermis ILC2s after IL-33&25. b, Quantification of (a). c, Percentage of Blimp-1 YFP in siLP ILC2s after IL-33&25. d, Quantification of (d). e, Histogram for Blimp-1 YFP in ILC2s after TSLP stimulation. f, Histogram for Blimp-1 YFP in ILC2s after NMU or IL-25 stimulation. g-i, Percentage of phosphorylated STAT5 stimulated with IL-33 (g) or TSLP (h), or percentage of phosphorylated STAT3 stimulated with IL-33 (i). (n=6) Each point represents one individual sorting sample from 2 pooled animals. The data are shown as means ± s.d., and present two or three independent experiments. A two-tailed unpaired t test was performed for b and d. *P < 0.05, *P < 0.01, ***P < 0.001, ****P < 0.0001. The specific P values are as follows: for b, P = 0.0004; for d, P < 0.0001.
Extended Data Fig. 4:
Extended Data Fig. 4:. Loss of Blimp-1 in ILC2s in vitro alters cytokines and transcriptomes.
a, Quantification of ControlIL7RaCre or Blimp-1IL7RaCre naïve state ILC2s number. b, Heatmap from RNA sequencing comparing ControlIL7RaCre with Blimp-1IL7RaCre ILC2s. Z-scores were calculated by TPM. c, Percentage of IL-9+ ILC2s from ControlNMUR1Cre or Blimp-1NMUR1Cre . (n=3) d, Percentage of IFNγ+ ILC2s from ControlNMUR1Cre or Blimp-1NMUR1Cre. e-j, Quantification of ILC2s IL-3 (e), GM-CSF (f), CCL2 (g), IL-4 (h), IL-5 (i) and IL-13 (j) production comparing ControlIL7RaCre with Blimp-1IL7RaCre. (n=2) Each point represents one individual sorting sample from 2 pooled animals. The data are shown as means ± s.d., and present two or three independent experiments. A multiple unpaired t-test was performed for a, c, e, f, g, h, i and j. *P < 0.05, *P < 0.01, ***P < 0.001, ****P < 0.0001. The specific P values are as follows: for a, P = 0.9244; for c, P = 0.0025; for e, P = 0.0071; for f, P = 0.0423; for g P = 0.0275; for h, P = 0.0038; for i, P = 0.0216; for j, P = 0.0038.
Extended Data Fig. 5:
Extended Data Fig. 5:. ILC2 Blimp-1 deficient animals exhibit mixed inflammatory responses to papain and tissue alarmins.
a, Percentage of NMUR1Cre-eGFP+ cells in CD4, CD8 and ILC2s. b, Percentage of ILC2s from lung in ControlNMUR1Cre or Blimp-1NMUR1Cre animals after IL-33&25. (n=3) c, Quantification of ST2 and KLRG1 GMFI in ILC2s, or total ILC2 number from ControlNMUR1Cre or Blimp-1NMUR1Cre. d, Quantification of neutrophils number from ControlNMUR1Cre or Blimp-1NMUR1Cre. e-h, Percentage of TNF+ CD4 (e), TNF+ CD8 (f), IFNγ+ CD4 (g) and IFNγ+ CD8 (h) from ControlNMUR1Cre or Blimp-1NMUR1Cre. (n=6) i and k, Percentage of mast cells (i) or eosinophils (k) from ControlNMUR1Cre or Blimp-1NMUR1Cre animals after papain. j and l, Quantification of mast cell number (j) or eosinophil number (l). Each point represents one individual animals. The data are shown as means ± s.d., and present two or three independent experiments. A multiple unpaired t-test was performed for c, d, e, f, g, h, j and l. *P < 0.05, *P < 0.01, ***P < 0.001, ****P < 0.0001. The specific P values are as follows: for c, comparison for ST2: P = 0.6754, comparison for KLRG1: P = 0.6154, comparison for ILC2 number: P = 0.4955; for d, P = 0.7788; for e, P = 0.0005; for f, P = 0.0131; for g, P = 0.2968; for h, P = 0.0249; for j, P = 0.1911; for l, P = 0.0494.
Fig. 1:
Fig. 1:. Blimp-1 is expressed in activated lung ILC2s in response to tissue inflammation and infection.
a, Representative H&E and PAS staining of lungs from indicated groups. Lung samples were fixed for histology (n=5) b, Representative flow plot of Blimp-1-YFP in ILC2s c, Quantification of (b). d and f, Representative flow plots of Blimp-1 YFP and IL-5 (d) or IL-13 (f) e and g, Quantification of IL-5+ (e) or IL-13+ (g) ILC2 from (d and f). h, Percentage of IL-5 and IL-13 expression in Blimp-1 YFP+ ILC2 or Blimp-1 YFP- ILC2. i and k, Representative flow plots of Blimp-1 YFP in ILC2s isolated from indicated groups. j and l, Quantification of Blimp-1 YFP+ ILC2s from (i, k). Each point represents one individual sample. The data are shown as means ± s.d., and present two or three independent experiments. A two-tailed unpaired t test was performed for b, e, g, j and l. Šídák's multiple comparisons test was performed for h. *P < 0.05, *P < 0.01, ***P < 0.001, ****P < 0.0001. The specific P values are as follows: for b: P = 0.0001; for e: P = 0.0055; for g: P = 0.0005; for h: comparison between IL-5, P < 0.0001, comparison between IL-13, P < 0.0001; for j: P = 0.0002; for l: P = 0.0002.
Fig. 2:
Fig. 2:. Blimp-1 is expressed in ILC2s across barrier and mucosal tissues.
a, Percentage of Blimp-1 YFP in ILC2s after HDM. b, Quantification of (a) (n=5) c-d, Quantification of Blimp-1 YFP percentage (c) and GMFI (d) after HDM or papain on day 4. e-g, Percentage (e), absolute number (f) of Blimp-1 YFP in ILC2s, or absolute number of ILC2s (g) at indicated timepoints. h, Representative flow plot for iILC2 gating after IL-25 i.p.. (n=4) i, Percentage of Blimp-1 YFP in ILC2 subsets from (h) j-k, Quantification of Blimp-1 YFP percentage (j) or GMFI (k) in nILC2 and iILC2. l, Percentage of Blimp-1 YFP in gut ILC2 after IL-33 and IL-25 i.p.. (n=6) m, Quantification of(l). Each point represents one individual sample. The data are shown as means ± s.d., and present two or three independent experiments. A two-tailed unpaired t test was performed forb, c, d and m. Tukey’s multiple comparisons test was performed for j, andk, and Kruskal-Wallis multiple comparisons test was performed for e, f and g. *P < 0.05, *P < 0.01, ***P < 0.001, ****P < 0.0001. The specific P values are as follows for b: P < 0.0001; for c: P = 0.0006; for d: P < 0.0001; for e, day0 vs. day18, P = 0.0016, day0 vs. day23, P = 0.0001; for f, day0 vs. day18, P = 0.0054, day0 vs. day23, P = 0.001; for g, day0 vs. day18, P = 0.0385, day0 vs. day23, P = 0.0084; for j: IL-25 iILC2s vs. IL-25 nILC2s, P = 0.0184, IL-25 iILC2s vs. Naive nILC2s, P < 0.0001, IL-25 nILC2s vs. Naive nILC2s, P < 0.0001; for k: IL-25 iILC2s vs. IL-25 nILC2s, P < 0.0001, IL-25 iILC2s vs. Naive nILC2s, P < 0.0001, IL-25 nILC2s vs. Naive nILC2s, P < 0.0001; for m: P < 0.0001.
Fig. 3:
Fig. 3:. IL-33 and IL-25 indirectly upregulate Blimp-1 in ILC2s.
a, Histogram for Blimp-1 YFP in ILC2s after stimulated with IL-33 or IL-25 for 3 days. b, Quantification of Blimp-1 GMFI from (a). (n=4) c, Histogram for ILC2s Blimp-1 expression at indicated time points when stimulated with IL-33&25. d, Quantification of(c). (n=4) e, Percentage of Blimp-1 YFP in stimulated ILC2s when treated with JAK inhibitor. f, Quantification of (e). (n=4) g, Percentage of Blimp-1 YFP in ILC2s from ST2 KO&WT ILC2 cell mixing experiment. h, Quantification of (g). i, Percentage of Blimp-1 YFP in ILC2s from ST2 KO&WT ILC2 transwell assay. j, Quantification of (i). Each point represents one individual sorting sample from 2 pooled animals. The data are shown as means ± s.d., and present two or three independent experiments. A two-tailed unpaired t test was performed for f. Dunnett's multiple comparisons test was performed for b, d and j. Tukey’s multiple comparisons test was performed for h. *P < 0.05, *P < 0.01, ***P < 0.001, ****P < 0.0001. The specific P values are as follows: for b: IL-2 vs. IL-2+IL-25, P = 0.0001, IL-2 vs. IL-2+IL-33, P < 0.0001; for d, Unstim vs. 12h, P = 0.0028, Unstim vs. 18h, P < 0.0001, Unstim vs. 24h, P < 0.0001, Unstim vs. 48h, P < 0.0001; for f, P = 0.0002; for h: ST2 KO ILC2s, mixed vs. ST2 WT ILC2s, mixed, P < 0.0001, ST2 KO ILC2s, mixed vs. ST2 KO ILC2s only, P < 0.0001, ST2 WT ILC2s, mixed vs. ST2 KO ILC2s only, P < 0.0001; for j: ST2 KO only vs. Transwell ST2 KO, P < 0.0001, ST2 KO only vs. Transwell ST2 WT, P < 0.0001.
Fig. 4:
Fig. 4:. IL-9 is the indispensable driver of Blimp-1 in ILC2s.
a-b, RNAseq comparing naïve ILC2s with ILC2s stimulated for 24 hrs with IL-33. Z-scores were calculated by TPM. c, Percentage of Blimp-1 YFP in ILC2s stimulated with IL-3, IL-9 or IL-24 for 24 hours. (n=3) d, Quantification of (c). e, Percentage of IL-9+ ILC2s at indicated timepoints when stimulated with IL-33. (n=3) f, Quantification of (e). g, Percentage of Blimp-1 YFP in ILC2s from transwell assay after treated with anti-IL-9 blocking antibody. h, Quantification of (g). (n=3) i, Percentage of Blimp-1 YFP in ILC2s after anti-IL-9 blockade in vivo. (n=6) j, Quantification of (i). k, Percentage of Blimp-1 YFP in ILC2s after IL-9 treatment for 3 days. (n=6) l, Quantification of (k). Each point represents one individual sorting sample from 2 pooled animals. The data are shown as means ± s.d., and present three or four independent experiments. A two-tailed unpaired t test was performed for j and l. Dunnett's multiple comparisons test was performed for d and f. Šídák's multiple comparisons test was performed for h. *P < 0.05, *P < 0.01, ***P < 0.001, ****P < 0.0001. The specific P values are as follows: for d, IL-2 vs. IL-2+IL-9, P = 0.0004; for F, Unstimulated vs. 1h, P = 0.003, Unstimulated vs. 2h, P = 0.0012, Unstimulated vs. 4h, P = 0.0002; for h, comparison within ST2 KO, P = 0.0001, comparison within ST2 WT, P < 0.0001; for j, P < 0.0001; for l, P < 0.0001.
Fig. 5:
Fig. 5:. Blimp-1 suppresses Type1 related genes in ILC2s.
a, Volcano plot from RNAseq comparing ControlIL7RaCre and Blimp-1IL7RaCre ILC2s. Threshold was set at log2fold change>1 and log10Pvalue<0.01. b, GSEA plot with enrichment in cytokines and chemokines in Blimp-1IL7RaCre ILC2s. NES: 1.55, P-value: 0.0001, FDR: 0.004. c-e, Heatmap for genes that were upregulated (c), no change (d), or downregulated (e) in Blimp-1IL7RaCre ILC2s. Z-scores were calculated by TPM. f, Percentage and quantification of TNFα+ ILC2s from ControlIL7RaCre or Blimp-1IL7RaCre with IL-33&25. (n=3) g, Representative ATAC-seq peaks near TNFα locus and IFNγ locus.h, Tornado plot for ATAC-seq differential peaks comparing Blimp-1 KO with WT ILC2s. i, Top results from HOMER motif analysis enriched in open chromatin regions of Blimp-1 KO ILC2s. Each point represents one individual sorting sample from 2 pooled animals. The data are shown as means ± s.d., and present three or four independent experiments. Unpaired t test was performed for f. *P < 0.05, *P < 0.01, ***P < 0.001. The specific P values are as follows: for f, P = 0.0006.
Fig. 6:
Fig. 6:. Blimp-1 knockout animals produce more Type1 cytokines upon activation and suppress tumor seeding.
a and c, Percentage of IFNγ+ (a) or TNF+ (c) ILC2s in ControlNMUR1Cre or Blimp-1NMUR1Cre animals after IL-33&25 i.n.. (n=6) b and d, Quantification of IFNγ (b) or TNF (d) expression from (a) and (c). e, Percentage of IL-5+ and IL-13+ ILC2s in ControlNMUR1Cre or Blimp-1NMUR1Cre animals after IL-33&25 i.n.. f-g, Quantification of IL-5 (f) or IL-13 (g) expression from (e). h-i, Representative flow plot for mast cells (h) or eosinophils (i) in ControlNMUR1Cre or Blimp-1NMUR1Creanimals. j-k, Quantification of mast cell number (j) or eosinophil number (k) from (h and i). l, Representative H&E and PAS staining of ControlNMUR1Cre or Blimp-1NMUR1Cre animals after IL-33&25 i.n. m, Percentage of IFNγ+ and TNF+ ILC2s in ControlNMUR1Cre or Blimp-1NMUR1Cre animals after papain i.n.. (n=6) n-o, Quantification of IFNγ (n) or TNF (o) expression from (m). p, Percentage of IL-5+ and IL-13+ ILC2s in ControlNMUR1Cre or Blimp-1NMUR1Cre animals after papain i.n. q-r, Quantification of IL-5 (q) or IL-13 (r) expression from (p). s, Representative H&E and PAS staining of ControlNMUR1Cre or Blimp-1NMUR1Cre animals after papain i.n..Each point represents one individual sample. The data are shown as means ± s.d., and present two independent experiments. A two-tailed unpaired t test was performed for b, d, f, g, j, k, n, o, q and r. *P < 0.05, *P < 0.01, ***P < 0.001, ****P < 0.0001. The specific P values are as follows for b: P = 0.0021; for d: P = 0.0007; for f, P < 0.0001; for g, P = 0.0009; for j: P = 0.0029; for k, P = 0.0326; for n, P = 0.0068; for o, P = 0.0133; for q, P < 0.0001; for r, P = 0.0011.

References

    1. Nunes C., Pereira A. M. & Morais-Almeida M. Asthma costs and social impact. Asthma Res. Pr. 3, 1 (2017). - PMC - PubMed
    1. Lambrecht B. N. & Hammad H. The immunology of asthma. Nat Immunol 16, 45–56 (2014). - PubMed
    1. Zheng H. et al. The Role of Type 2 Innate Lymphoid Cells in Allergic Diseases. Front. Immunol. 12, 586078 (2021). - PMC - PubMed
    1. Oliphant C. J. et al. MHCII-Mediated Dialog between Group 2 Innate Lymphoid Cells and CD4+ T Cells Potentiates Type 2 Immunity and Promotes Parasitic Helminth Expulsion. Immunity 41, 283–295 (2014). - PMC - PubMed
    1. Gurram R. K. & Zhu J. Orchestration between ILC2s and Th2 cells in shaping type 2 immune responses. Cell. Mol. Immunol. 16, 225–235 (2019). - PMC - PubMed

Publication types

LinkOut - more resources