. 2025 Apr 18;7(2):fcaf153.
doi: 10.1093/braincomms/fcaf153. eCollection 2025.

Ongoing loss of viable neurons for weeks after mild hypoxia-ischaemia

Affiliations

Ongoing loss of viable neurons for weeks after mild hypoxia-ischaemia

Melanie A McNally et al. Brain Commun. .

Abstract

Mild hypoxic-ischaemic encephalopathy is common in neonates, and there are no evidence-based therapies. By school age, 30-40% of those patients experience adverse neurodevelopmental outcomes. The nature and progression of mild injury is poorly understood. We studied the evolution of mild perinatal brain injury using longitudinal two-photon imaging of transgenic fluorescent calcium-sensitive and insensitive proteins to provide a novel readout of neuronal viability and activity at cellular resolution in vitro and in vivo. In vitro, perinatal organotypic hippocampal cultures underwent 15-20 min of oxygen-glucose deprivation. In vivo, mild hypoxia-ischaemia was completed at post-natal day 10 with carotid ligation and 15 min of hypoxia (FiO2, 0.08). Consistent with a mild injury, minimal immediate neuronal death was seen in vitro or in vivo, and there was no volumetric evidence of injury by ex vivo MRI 2.5 weeks after injury (n = 3 pups/group). However, in both the hippocampus and neocortex, these mild injuries resulted in delayed and progressive neuronal loss by the second week after injury compared to controls; measured by fluorophore quenching (n = 6 slices/group in vitro, P < 0.001; n = 8 pups/group in vivo, P < 0.01). Mild hypoxia-ischaemia transiently suppressed cortical network calcium activity in vivo for over 2 h after injury (versus sham, n = 13 pups/group; P < 0.01). No post-injury seizures were seen. By 24 h, network activity fully recovered, and there was no disruption in the development of normal cortical activity for 11 days (n = 8 pups/group). The participation in network activity of individual neurons destined to die in vivo was indistinguishable from those that survived up to 4 days post-injury (n = 8 pups/group). Despite a lack of significant immediate neuronal death and only transient disruptions of network activity, mild perinatal brain injury resulted in a delayed and progressive increase of neuronal death in the hippocampus and neocortex. Neurons that died late were functioning normally for days after injury, suggesting a new pathophysiology of neuronal death after mild injury. Critically, the neurons destined to die late demonstrated multiple biomarkers of viability long after mild injury, suggesting their later death may be modified with neuroprotective interventions.

Keywords: GCaMP; mild hypoxic-ischaemic injury; neocortex; network; neuronal death.


Conflict of interest statement

The authors report no competing interests.

Figures

Graphical Abstract
Graphical Abstract
Figure 1
Figure 1
In vivo and in vitro experimental designs. (A) In vitro experimental design with representative hippocampal two-photon (2P) fluorescence images of syn-GCaMP6s expression (standard deviation projection of GCaMP6 s activity; white and green) and syn-mRuby (magenta). Scale bar on merged images = 25 μm. Intracerebroventricular injection (ICV), days in vitro (DIV), post-natal day (P), magnetic resonance imaging (MRI), immunohistochemistry (IHC). (B) In vivo experimental design with image of mouse pup with implanted custom designed titanium head bar and cranial window. Additional representative layer II/III somatosensory cortex 2P fluorescence image of merged syn-GCaMP6s standard deviation projection (green) and syn-mRuby (magenta) is shown. Scale bar = 25 μm. (C) Representative immunostaining confocal image of syn-driven neuronal GCaMP6 s (detected by anti-GFP) and mRuby co-expression in layer II/III somatosensory cortex of a P25 animal post-hypoxia-ischaemia (HI). Manual quantification verified 74% co-expression (n = 136 neurons). Scale bar = 25 μm.
Figure 2
Figure 2
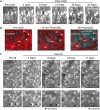
Longitudinal tracking of hippocampal and cortical neuron survival. (A) Two-photon (2P) fluorescence images tracking mRuby-positive hippocampal pyramidal neurons in vitro after oxygen-glucose deprivation (OGD). The starred neuron showed dendritic retraction and swelling prior to quenching at 23 days. (B) Representative 2P fluorescence images of mRuby-positive hippocampal pyramidal neurons in vitro incubated with NucView® Blue Caspase-3 dye. Neurons that survived post-OGD (arrows) did not show caspase activation acutely. Neurons are shown that quenched 2 h post-OGD with (filled arrowhead) and without (open arrowhead) caspase activation. (C) Unanesthetized, in vivo 2P fluorescence images of layer II/III somatosensory cortex over time after hypoxia-ischaemia (HI) demonstrating tracking of mRuby-positive cortical neurons. Shown are examples of neurons that quenched 6 days post-HI (open arrowhead) and 11 days post-HI (closed arrowhead). Scale bars = 25 μm.
Figure 3
Figure 3
Persistently elevated rate of hippocampal and cortical neuronal death after mild perinatal hypoxia-ischaemia. (A) In vitro hippocampal neuron Kaplan-Meier curve for control conditions (n = 6 slices, 227 neurons, 26–49 neurons/slice) versus oxygen glucose deprivation (OGD) (n = 6 slices, 277 neurons, 42–56 neurons/slice). In a model controlling for within-animal variation, the risk of neuronal death was significantly higher after OGD compared to control conditions [P < 0.001, hazard ratio 2.88 (95% CI = 1.6, 5.19), z = 5.4, Wald test]. (B) In vivo cortical neuron Kaplan-Meier curve for sham [n = 8 pups (5 female, 3 male), 376 neurons, 21–79 neurons/pup] versus hypoxia-ischaemia (HI) [n = 8 pups (3 female, 5 male), 389 neurons, 18–85 neurons/pup]. In a model controlling for within-animal variation, the risk of neuronal death was significantly higher after mild HI compared to sham [P < 0.001, hazard ratio 3.242 (95% CI = 1.8, 5.84), z = 4.9, Wald test].
Figure 4
Figure 4
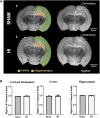
No moderate or severe injury detected by ex vivo MRI after mild perinatal hypoxic-ischaemic injury. (A) Representative T2-weighted magnetic resonance imaging (MRI) coronal slices from sham and hypoxia-ischaemia (HI) animals at location of two-photon imaging. Overlays of the measured regions of interest for volumetric measures at that slice are shown. (B) No asymmetries were seen between cerebral hemispheres (t = 1.7, df = 4, P > 0.05, unpaired t-test), cortices (t = 0.78, df = 4, P > 0.05, unpaired t-test) or hippocampi (t = 0.63, df = 4, P > 0.05, unpaired t-test) in sham (n = 3, all female) or HI animals (n = 3, 2 female and 1 male) 18 days post-injury (P28; mean ± standard deviation). Each data point represents the respective values from a single animal.
Figure 5
Figure 5
Mild perinatal hypoxia-ischaemia transiently disrupted cortical network activity. (A) Representative raster plots of ΔF/F syn-GCaMP6 s calcium signal taken at 1.1 Hz from one sham and one hypoxia-ischaemia (HI) animal at baseline, 1 h post, and 24 h post timepoints. Representative, corresponding traces to HI raster plots of the fraction of co-active neurons at baseline, 1 h-, and 24 h-post HI are also shown. (B) Mean ± standard deviation of network calcium activity metrics in HI [n = 13 (6 male, 7 female), open circles] versus sham [n = 13 (7 male, 6 female), filled circles] animals at baseline (BL), 1 and 24 h timepoints. The frequency and duration of network events per animal is shown. Network activation is the average proportion of co-active cells per network event per animal. Two-way ANOVA [network event frequency F(2, 41) = 21.3, P < 0.01; network event duration F(2, 41) = 9.9, P < 0.001; network activation F(2, 41) = 47.4, P < 0.01] with post hoc Tukey tests, ****P < 0.0001, *** P < 0.0001, ** P < 0.002.
Figure 6
Figure 6
In vivo synchronous cortical activity was preserved 11 days after mild perinatal hypoxic-ischaemic injury. Mean ± standard deviation of network calcium activity metrics in hypoxia-ischaemia (HI) [n = 8 (3 female, 5 male), open circles) versus sham (n = 8 (5 female, 3 male), filled circles] animals 11 days after injury. The frequency and duration of cortical events per animal is shown. Cortical activation represents the average proportion of co-active cells (‘Fraction Co-Active’) per network event per animal. No differences were detected between groups for cortical event frequency (t = 0.73, df = 14, P = 0.47, unpaired t-test), cortical event duration (t = 0.33, df = 14, P = 0.75, unpaired t-test) and cortical activation (t = 0.24, df = 14, P = 0.81, unpaired t-test).
Figure 7
Figure 7
No difference in network participation of cortical neurons that die versus survive after mild perinatal hypoxia-ischaemia in vivo. (A) The fraction of total network events that individual neurons were active during (‘neuronal network participation’) was plotted for neurons that quenched prior to day 11 (‘died’, open circles) post-sham (blue striped) or post-hypoxia-ischaemia (HI, orange striped) versus those neurons that survive past day 11 (‘survived’, filled circles) post-sham (blue) or post-HI (orange). Data are shown as mean ± standard deviation at each timepoint after mild HI injury or sham for each group (n = 6–8 pups/group/timepoint, 3–333 neurons/group/timepoint). Neuronal network participation of individual neurons destined to die was not different from neurons that survived in either sham or HI animals overall, or at baseline, 1-, 2-, and 4-days post-HI (HI, F = 0.29, df = (1,16), P = 0.60; Sham F = 1.72, df = (1,14), P = 0.21; Type III F-test for fixed effect, linear mixed effects (LME) models used to account for correlation within pups]. Each data point represents the value from a single neuron. (B) Baseline neuronal network participation was not predictive of later neuronal death. Associations between neuronal network participation at baseline (P10) versus day of death are shown for all neurons. LME models, accounting for correlation within pups, showed no statistical associations among all neurons [16 pups, 85 neurons; F-statistic = 0.74, df (1,69), P = 0.39], HI neurons [8 pups, 62 neurons; F-statistic = 0.43, df = (1,53) = P = 0.51] and sham neurons [8 pups, 23 neurons; F-statistic = 2.25, df = (1,15), P = 0.15]. Ninety-fifth percentile confidence limits shown with dashed lines. Each data point represents the value from a single neuron.

Update of

Similar articles

References

    1. Kurinczuk JJ, White-Koning M, Badawi N. Epidemiology of neonatal encephalopathy and hypoxic-ischaemic encephalopathy. Early Hum Dev. 2010;86(6):329–338. - PubMed
    1. Lee ACC, Kozuki N, Blencowe H, et al. Intrapartum-related neonatal encephalopathy incidence and impairment at regional and global levels for 2010 with trends from 1990. Pediatr Res. 2013;74(SUPPL. 1):50–72. - PMC - PubMed
    1. Robertson CMT, Finer NN, Grace MGA. School performance of survivors of neonatal encephalopathy associated with birth asphyxia at term. J Pediatr. 1989;114(5):753–760. - PubMed
    1. Sarnat HB, Sarnat MS. Neonatal encephalopathy following fetal distress. JAMA Neurol Arch. 1976;33:696–705. - PubMed
    1. Shankaran S, Laptook AR, Pappas A, et al. Effect of depth and duration of cooling on deaths in the NICU among neonates with hypoxic ischemic encephalopathy a randomized clinical trial. JAMA. 2014;312(24):2629–2639. - PMC - PubMed

LinkOut - more resources