. 2025 Apr 28;9(4):e70060.
doi: 10.1002/pld3.70060. eCollection 2025 Apr.

A Method to Visualize Cell Proliferation of Arabidopsis thaliana: A Case Study of the Root Apical Meristem

Affiliations

A Method to Visualize Cell Proliferation of Arabidopsis thaliana: A Case Study of the Root Apical Meristem

J Irepan Reyes-Olalde et al. Plant Direct. .

Abstract

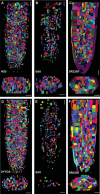
Plant growth and development rely on a delicate balance between cell proliferation and cell differentiation. The root apical meristem (RAM) of Arabidopsis thaliana is an excellent model to study the cell cycle due to the coordinated relationship between nucleus shape and cell size at each stage, allowing for precise estimation of the cell cycle duration. In this study, we present a method for high-resolution visualization of RAM cells. This is the first protocol that allows for simultaneous high-resolution imaging of cellular and nuclear stains, being compatible with DNA replication markers such as EdU, including fluorescent proteins (H2B::YFP), SYTOX DNA stains, and the cell wall stain SR2200. This protocol includes a clarification procedure that enables the acquisition of high-resolution 3D images, suitable for detailed subsequent analysis.

Keywords: 5‐ethynyl‐2‐deoxyuridine (EdU); cell and nuclear markers; cell cycle; root apical meristem.


Conflict of interest statement

The authors declare no conflicts of interest.

Figures

FIGURE 1
FIGURE 1
Single confocal plane images of longitudinal sections of the Arabidopsis roots fixed and stained. (A) Widefield image. (B) H2B::YFP line fixed with FA and permeabilized displaying the YFP signal (green). (C) Confocal image of an H2B::YFP root stained with SR2200. (D) Confocal image of EdU‐ Eterneon‐labeled cells and SR2200‐stained cells from the meristem region of 1 h EdU‐treated root tips. (E) EdU/H2B::YFP line labeled root tips. EdU‐Eterneon‐labeled cells is red color specifically labels nuclei undergoing DNA Replication, while H2B::YFP‐green labels all nuclei. (F) Confocal image of EdU/H2B::YFP line labeled root tips and cell wall staining with SR2200. Insets show EdU‐Eterneon‐labeled cells distributions in whole and speckled patterns and cell wall staining. The white arrowhead marks speckled pattern, while white the arrow marks the whole pattern of nuclei in the DNA replication. The roots were not cleared, and to ensure proper dye incorporation, they were subjected to fixation and vacuum infiltration. Scale bars: 20 μm (A–F), 10 μm (F insets).
FIGURE 2
FIGURE 2
Single confocal plane images of Arabidopsis roots staining and EdU‐Eterneon click reaction, without clearing protocol. (A) Confocal image of Col‐0 root treated and stained with SYTOX green. SYTOX Green stain binds nucleic acids of the nucleus. (B) Col‐0 root treated and stained with Hoechst 34580. (C) Confocal image of double dye Hoechst 34580/SYTOX Green from Col‐0 root. The SYTOX Green and Hoechst 34580 showed a clear nuclei signal. (D) Confocal image of Col‐0 root treated and stained with SYTOX Orange. (E) EdU/SYTOX Green labeled root tips. EdU‐Eterneon are red color marks nuclei undergoing the DNA replication, while SYTOX Green marks nuclear acids. White arrowhead marks mitotic figures. The blue arrowhead marks a speckled pattern, while the blue arrow marks the whole pattern of nuclei in the DNA replication. Scale bars = 20 μm (A–E).
FIGURE 3
FIGURE 3
3D reconstruction of roots cleared following the scale‐based method and stained with nuclear and cell wall dyes. (A, B) Maximum intensity projection of a z‐stack of SYTOX‐stained (A), or Hoechst 34580‐stained (B) Arabidopsis roots without clearing. (C–F) Scale‐based method in SYTOX‐stained (C, E), Hoechst 34580 (D), and SR2200 (F). Scale bars = 20 μm.
FIGURE 4
FIGURE 4
3D reconstruction of Arabidopsis roots treated with a scale‐based method and pre‐stained. (A–C) 3D reconstruction of 70 serial optical sections of H2B::YFP and EdU‐Eterneon‐labeled cells in roots using a scale‐based method. EdU‐Eterneon labeling (red) marks nuclei undergoing DNA replication, while H2B::YFP (green) labels the entire nucleus. (D–F) 3D projection of roots SYTOX‐stained and EdU. EdU‐positive nuclei (red) marks nucleus with DNA replication and SYTOX Green (Green) marks nuclear acids. Scale bars = 20 μm.
FIGURE 5
FIGURE 5
Confocal microscopic images of a scale‐based method root with H2B::YFP, EdU‐Eterneon and SR2200. 3D reconstruction of 70 serial optical sections obtained from the same root as in (A) SR2200, (B) EdU‐Eterneon‐labeled cells, and (C) H2B::YFP views. The signals of H2B::YFP, EdU, and SR2200 are represented in green, red, and blue, respectively. (D) Merge and (E) single confocal plane image of a root staining with EdU‐H2B::YFP‐SR2200. The white arrowhead marks a speckled pattern, while the white arrow marks the whole pattern of nuclei in DNA replication. Scale bars = 20 μm.
FIGURE 6
FIGURE 6
Application of the scale‐based method for the visualization of DNA replication in Arabidopsis root and stained with chemical dyes. 3D reconstruction of 70 serial optical sections obtained from the same root as in (A) Single plane and 3D reconstruction of SR2200, (B) EdU‐Eterneon‐labeled cells, (C) SYTOX‐stained, (D) merge, and (E) single confocal plane image of a root stained with EdU‐SYTOX‐SR2200. An arrowhead and an arrow indicate a speckled nuclear pattern and a whole nuclear pattern, respectively. Scale bars = 20 μm.
FIGURE 7
FIGURE 7
3D visualization of segmented cells, nucleus and DNA replication. Segmentation reconstruction from the same root. (A) 3D segmentation of nucleus (H2B::YFP) and (D) nucleus stained by SYTOX. (B, E) 3D segmentation of cells in phase S (EdU staining of DNA replication). (C, F) 3D image of cell wall stained by SR2200. Scale bars = upper and lower 20 μm (A–F).
FIGURE 8
FIGURE 8
Applications of nuclei segmentation. (A) Distribution of nuclei volume in the roots of Arabidopsis thaliana . (B) Scatter plot showing the relationship between nuclei volume and surface area on a logarithmic scale.

References

    1. Alberts, B. , Johnson A., Lewis J., et al. 2017. Molecular Biology of the Cell. 7th ed. New York: Garland Science.
    1. Aragón‐Raygoza, A. , Vasco A., Blilou I., Herrera‐Estrella L., and Cruz‐Ramírez A.. 2020. “Development and Cell Cycle Activity of the Root Apical Meristem in the Fern Ceratopteris richardii .” Genes (Basel) 11, no. 12: 1455. 10.3390/genes11121455. - DOI - PMC - PubMed
    1. Boisnard‐Lorig, C. , Colon‐Carmona A., Bauch M., et al. 2001. “Dynamic Analyses of the Expression of the Histone::YFP Fusion Protein in Arabidopsis Show That Syncytial Endosperm Is Divided in Mitotic Domains.” Plant Cell 13, no. 3: 495–509. 10.1105/tpc.13.3.495. - DOI - PMC - PubMed
    1. Boothe, T. , Hilbert L., Heide M., et al. 2017. “A Tunable Refractive Index Matching Medium for Live Imaging Cells, Tissues and Model Organisms.” eLife 6: e27240. - PMC - PubMed
    1. Bucevičius, J. , Lukinavičius G., and Gerasimaitė R.. 2018. “The Use of Hoechst Dyes for DNA Staining and Beyond.” Chem 6: 18.

LinkOut - more resources