. 2025 Sep 3;148(9):3137-3152.
doi: 10.1093/brain/awaf163.

Disruption of DNA methylation underpins the neuroinflammation induced by targeted CNS radiotherapy

Affiliations

Disruption of DNA methylation underpins the neuroinflammation induced by targeted CNS radiotherapy

Thomas O Millner et al. Brain. .

Abstract

Targeted radiotherapy is integral to the increasing survival of cancer patients; however, it has significant side effects, the underlying cellular and molecular mechanisms of which are ill-defined. It is well documented that targeted radiotherapy induces epigenetic changes in neoplastic tissue, which impacts tumour evolution; however, whether epigenetic deregulation also occurs in the surrounding non-neoplastic tissue and contributes to the occurrence of side effects is unknown. We characterized the DNA methylome in a unique cohort of irradiated peri-lesional brain tissue samples and integrated it with gene expression analysis at the spatial level. We show differences in DNA methylation patterns in irradiated brain tissue and identify specific inflammatory micro-environmental niches and their regulatory neuropeptides after irradiation. Finally, we show in a cerebral organoid model, that the same neuropeptides are upregulated as well as similar DNA methylation alterations and disruption of the DNA methylation machinery, in keeping with the interpretation that epigenetic dysregulation plays a role in neurotoxicity, hence raising the possibility it could represent a novel target for the reduction of radiotherapy side effects.

Keywords: DNA methylation; epigenetics; neuro-oncology; neuroinflammation; radiotherapy; spatial transcriptomics.


Conflict of interest statement

The authors report no competing interests.

Figures

Figure 1
Figure 1
Targeted radiotherapy drives differences in the DNA methylome and transcriptome of human peri-lesional brain tissue. (A) Summary of the experimental pipeline for human tissue analysis; created in BioRender. Marino, S. (2025) https://BioRender.com/rgn40vq. (B) Principal component analysis of bulk DNA methylation data using all probes after standard filtering. (C) Heat map dendrogram for the 4000 most variable differentially methylated probes (DMPs) identified from the FFPE samples. Both row and column clustering were performed (see main text and Table 1 for details on RT_Met and RT_Other). (D) Bar plot showing number and length (in kilobase pairs) of hyper- and hypomethylated DMRs. (E) Bar plot showing genomic location of DMRs as a percentage. Left bar represents the whole genome as represented on the DNA methylation array. (F) Selected Gene Set Enrichment Analysis plots for all differentially methylated genes. DMR = differentially methylated region; FFPE = formalin-fixed paraffin-embedded; NES = normalized enrichment score.
Figure 2
Figure 2
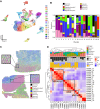
Spatial transcriptomics reveals specific micro-environmental niches after irradiation. (A) UMAP plot showing all spatial transcriptomic (ST) spots after filtering (39 157 in total). Each dot corresponds to a single ST spot, coloured by cluster, after unsupervised clustering. (B) Bar plot depicting the proportion of deconvoluted cell types in each cluster using STDeconvolve. (C) Two representative spatial plots showing deconvolved cell-type distribution across the sample. Each pie chart represents a ST spot and the proportions of the pie chart represent the deconvolved cell-type proportions (see also Supplementary Fig. 3). Colours are as for B. (D) Clustered correlation plot for ST cluster marker genes and bar plots of the proportion of cortex/white matter location, experimental group and cell-type proportions for spots within each cluster. Groups of clusters are annotated as per the main text. UMAP = uniform manifold approximation and projection.
Figure 3
Figure 3
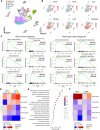
Irradiated neurons residing in an inflammatory micro-environment with active neuropeptide and cytokine signalling. (A) UMAP plot showing all spatial transcriptomic (ST) spots, coloured by control and radiotherapy (RT) glial and neuronal clusters. (B) UMAPs of all ST spots showing expression of glial (GFAP, PLP, CLU) and neuronal (STMN2, SYT1, CAMK2A) markers. (C) Selected Gene Set Enrichment Analysis plots for differentially expressed genes from RT glial clusters (left) and RT neuronal clusters (right). (D) Heat map of correlation between signature score for top 200 hyper- and hypomethylated genes from bulk DNA methylation and cell-type proportions of all ST spots. (E) Selected gene ontology pathways from 124 genes concordantly upregulated in irradiated neuronal niches (see also Supplementary Fig. 5E). (F) Heat map shows correlation between TAC1 and PENK expression and cell-type proportions of all ST spots. DMG = differentially methylated gene; NES = normalized enrichment score; UMAP = uniform manifold approximation and projection.
Figure 4
Figure 4
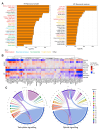
Receptor-ligand analysis of spatial transcriptomic data confirms neuropeptide activity. (A) Bar plots showing the 25 most significantly different receptor-ligand (R-L) pairs when interaction scores were compared between control and radiotherapy (RT) neuronal clusters. Additionally, OPRD1-PENK is shown in the RT-neuronal sender plot; see also Supplementary material. Interaction scores between clusters were compared using a Wilcoxon test, and P-values were adjusted for multiple hypothesis testing using the Benjamini-Hochberg procedure. (B) Heat map dendrogram showing correlation between expression of genes from R-L analysis with cell type proportions in all spatial transcriptomic (ST) spots. (C) Circos plots showing tachykinin and opioid R-L interactions between ST clusters. Chord thickness represents the number of R-L interactions. FDR = false discovery rate.
Figure 5
Figure 5
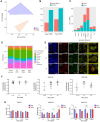
After irradiation in a cerebral organoid model, disruption of DNA methylation patterns is accompanied by dysregulation of DNMTs. (A) Principal component analysis of cerebral organoid (CO) DNA methylation data using all probes after standard filtering. (B) Bar plot showing number and length (in kilobase pairs) of hyper- and hypomethylated DMRs. (C) Bar plot depicting the number of DMRs by genomic region, with the proportion of hypermethylated (red) and hypomethylated (blue) DMRs. (D) Bar plot showing genomic location of DMRs as a percentage. The left bar is the whole genome as represented on the DNA methylation array. (E) Representative immunofluorescence images illustrating colocalization of γH2AX (red) with DNMT1, DNMT3A and DNMT3B (green) at 1 h post-irradiation. The overlay images demonstrate points of colocalization in yellow. Nuclei were counterstained for DAPI (blue). Scale bars are 20 μm. See also Supplementary Fig. 9B–D. (F) Dot plots of Manders colocalization coefficient (M1) value for γH2AX colocalizing with DNMT1 (left), DNMT3A (centre) and DNMT3B (right) from individual nuclei from COs at time points ranging from 1 min to 6 h post-irradiation. The error bars represent standard deviation. See also Supplementary Fig. 9B–D. (G) Bar plots depicting relative mean fluorescence intensity (MFI) of DMNT1 (left), DNMT3A (middle) and DNMT3B (right) at time points ranging from 1 h to 3 days post-irradiation. Each data-point on the graph represents pooled data from a single CO. Unpaired t-test was performed to assess statistical significance. Error bars represent the standard error of the mean. See also Supplementary Fig. 10. *P ≤ 0.05. DMR = differentially methylated region; TE = transposable element.
Figure 6
Figure 6
Single-cell RNA sequencing in cerebral organoid model shows recapitulation of irradiated neuronal phenotype at early time points. (A) UMAP plot showing neuroglial cells, coloured by cell-type (left) and experimental condition (right). (B) Violin plots for signature scores of spatial transcriptomic (ST) neuronal radiation signature in excitatory neurons (left) and for ST glial radiation signature in oligodendrocyte/glial precursors (right). Wilcoxon test. (C) Selected Gene Set Enrichment Analysis plots for all excitatory neuron differentially expressed genes. (D) Expression of TAC1 (top) and PENK (bottom) in excitatory neurons is shown in the box and whisker plot (left) and UMAP with all neuroglial cells (right). Wilcoxon test. (E) Bar plots depicting relative expression of TAC1 and PENK using RT-qPCR at 1 and 4 weeks after irradiation. Significance was tested with unpaired t-test. (F) Circos plot showing all significant receptor-ligand interactions involving ex.Neurons. TAC1 and PENK interactions are highlighted in red. (G) Heat map shows concordant genes in the cerebral organoid (CO). (H) Bubble plot shows changes in DNA methylation machinery genes after irradiation by cell type. *P ≤ 0.05, **P ≤ 0.01, ***P ≤ 0.001, ****P ≤ 0.0001. Ex.Neuron = excitatory neuron; NES = normalized enrichment score; OPC = oligodendrocyte progenitor cell; RG = radial glia; RT = radiotherapy; UMAP = uniform manifold approximation and projection.
Figure 7
Figure 7
Schematic showing proposed interaction between targeted radiotherapy, disruption of DNA methylation and chronic neuroinflammation to produce radiation-induced brain injury. See main text for details; Created in BioRender. Marino, S. (2025) https://BioRender.com/w6bjgma.

Comment in

References

    1. Sung H, Ferlay J, Siegel RL, et al. Global cancer statistics 2020: GLOBOCAN estimates of incidence and mortality worldwide for 36 cancers in 185 countries. CA Cancer J Clin. 2021;71:209–249. - PubMed
    1. Nayak L, Lee EQ, Wen PY. Epidemiology of brain metastases. Curr Oncol Rep. 2012;14:48–54. - PubMed
    1. Kleinerman RA. Cancer risks following diagnostic and therapeutic radiation exposure in children. Pediatr Radiol. 2006;36:121–125. - PMC - PubMed
    1. Lumniczky K, Szatmári T, Sáfrány G. Ionizing radiation-induced immune and inflammatory reactions in the brain. Front Immunol. 2017;8:517. - PMC - PubMed
    1. Gutierrez-Quintana R, Walker DJ, Williams KJ, Forster DM, Chalmers AJ. Radiation-induced neuroinflammation: A potential protective role for poly(ADP-ribose) polymerase inhibitors? Neurooncol Adv. 2022;4:vdab190. - PMC - PubMed