. 2025 Apr 22;53(8):gkaf352.
doi: 10.1093/nar/gkaf352.

Replicative DNA polymerase epsilon and delta holoenzymes show wide-ranging inhibition at G-quadruplexes in the human genome

Affiliations

Replicative DNA polymerase epsilon and delta holoenzymes show wide-ranging inhibition at G-quadruplexes in the human genome

Suzanne E Hile et al. Nucleic Acids Res. .

Abstract

G-quadruplexes (G4s) are functional elements of the human genome, some of which inhibit DNA replication. We investigated replication of G4s within highly abundant microsatellite (GGGA, GGGT) and transposable element (L1 and SVA) sequences. We found that genome-wide, numerous motifs are located preferentially on the replication leading strand and the transcribed strand templates. We directly tested replicative polymerase ϵ and δ holoenzyme inhibition at these G4s, compared to low abundant motifs. For all G4s, DNA synthesis inhibition was higher on the G-rich than C-rich strand or control sequence. No single G4 was an absolute block for either holoenzyme; however, the inhibitory potential varied over an order of magnitude. Biophysical analyses showed the motifs form varying topologies, but replicative polymerase inhibition did not correlate with a specific G4 structure. Addition of the G4 stabilizer pyridostatin severely inhibited forward polymerase synthesis specifically on the G-rich strand, enhancing G/C strand asynchrony. Our results reveal that replicative polymerase inhibition at every G4 examined is distinct, causing complementary strand synthesis to become asynchronous, which could contribute to slowed fork elongation. Altogether, we provide critical information regarding how replicative eukaryotic holoenzymes navigate synthesis through G4s naturally occurring thousands of times in functional regions of the human genome.


Conflict of interest statement

None declared.

Figures

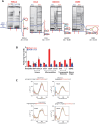
Graphical Abstract
Graphical Abstract
Figure 1.
Figure 1.
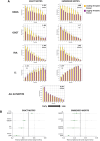
Genome-wide analyses of replication and transcriptional status of abundant G4 motifs. (A) Replication timing and leading/lagging strand bias. Repli-seq data were derived from the ENCODE Project and analyzed for 14 cell lines to infer leading/lagging replication fork directionality and early/late replication timing using deciles [36]. For each cell line, the number of occurrences of each G4 motif at each decile was estimated and results were averaged across the 14 cell lines. Error bars, standard deviation across the 14 cell lines. Replication timing proceeds early to late from left to right on the graphs. "All G4 motifs" is the analysis of all putative G4 motifs in the human genome. “Exact motifs,” G4s that are an exact match to the sequence in Table 1; “Embedded motifs,” G4s within an extended predicted G4-forming sequence (Supplementary Table S2). Effect size for replication strand bias was determined by the enrichment of leading versus lagging strand template G4 occurrences and is shown on each graph, along with the binomial test P-value. Significant values are in bold. *P < 0.05; **P < 0.01; ***P < 0.001; ****P < 0.0001; ns; not significant. Detailed statistics are given in Supplementary Table S3. (B) Transcriptional strand bias. Strand Asymmetry < 0.5 is template-bias, while >0.5 is nontemplate bias. Errors bars were generated with bootstrap and replacement (N = 10 000). The binomial test was used for statistical analyses and P-values were adjusted for multiple testing using Bonferroni correction, with asterisks displaying the same P-value cutoffs as in panel (A).
Figure 2.
Figure 2.
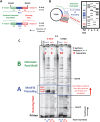
Biochemical assay to measure Polϵ/δ holoenzyme synthesis on complementary G- and C-rich templates. (A) Cloning scheme. G4s motifs and flanking sequences are inserted into the pGEM3Zf(-) vector in both orientations in between the BamHI site. Top, orientation of the G-rich strand. Bottom, orientation of the reverse complement C-rich strand. F1 and F2, flanking sequences. The running start contains sequence from both the vector and flanking sequence. (B) Polymerase pausing assay schematic. Template ssDNA is prepared for each complementary strand. A 32P-end labeled primer (solid line with asterisk) is hybridized for use in polymerase reactions, generating products of varying lengths which are separated by denaturing polyacrylamide gel electrophoresis. Bases where the polymerase has difficulty incorporating the next base will generate a dark pronounced band where synthesis products have accumulated (thick bands in reaction lane). The identity of the base(s) of this polymerase pause site is determined by comparing its location to that of the sequencing ladder. (C) Representative titration gel. DNA synthesis products using the L1 DNA substrate. Polδ: DNA molar ratios increased from 0.1 to 0.5:1 and Polϵ: DNA ratios increased from 0.01 to 0.05: 1 (filled triangles). All reactions were performed for 15 minutes. No pol, control without polymerase and % Hyb, total amount of productively hybridized primer-template. CG, sequencing ladder. Solid lines demarcate Region A. Numbers underneath image indicate total % synthesis (total amount of extended product versus extended and un-extended product) for that reaction lane. Numbers at the top of the image indicate the % synthesis products in Regions A + B. Reaction conditions in which this synthesis was 20%–50% are denoted by stars and are examples of reactions used for subsequent quantitative analyses.
Figure 3.
Figure 3.
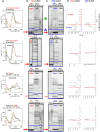
Variable effects of G4 structures on replicative holoenzyme synthesis. (A) Characterization of G4 motifs by CD spectral analysis. Spectra for oligonucleotides of each G4 motif were generated by sequentially adding reaction components: 1 mM Na-phosphate (blue), 40 mM Tris–HCl (pH 7.5, yellow), 8 mM MgOAc2 (green), 150 mM KCl (red), 1 mM DTT (light green), 200 μg/ml BSA (light blue), 5% glycerol (pink), and after 24 h (dashed pink). See Supplementary Fig. S2 for spectra after thermal denaturation followed by slow annealing. (B) Efficiency of Polϵ synthesis through G4 motifs. Representative gels showing replicate polymerase reactions in which Polϵ synthesizes the G-rich strand and Polδ synthesizes the C-rich strand for the indicated G4 motifs. (C) Efficiency of Polδ synthesis through G4 motifs. Representative gels showing replicate polymerase reactions when Polδ synthesizes the G4 motif-containing strand and Polϵ synthesizes the C-rich strand for indicated G4 motifs. Triangles indicate an increase in reaction time from 5 to 15 min. TACG; sequencing ladder. Solid horizontal lines demarcate Region A. Arrows indicate the first base of the G-rich motif, with thicker arrows denoting stronger polymerase inhibition. (D) Densitometry scans of Polϵ (left) and Polδ (right) reaction products within Region A of the G-rich strand. ImageQuant histograms showing polymerase reaction product band intensity (counts; horizontal axis) with distance in the reaction lane in millimeters (mm; vertical axis). Histograms start at 7 nt (L1) or 10 nt (all other motifs) preceding the G4 motif (bottom of graph) and end after the last base of the G4 (top of graph). Direction of polymerase synthesis is from bottom to top. Horizontal line indicates G4 beginning. See Supplementary Fig. S3 for full gel images.
Figure 4.
Figure 4.
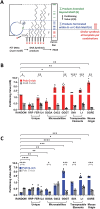
Partitioning values demonstrate that holoenzyme inhibition by each G4 is distinct. (A) Schematic of PV calculation. Two primer-templates per motif (G-rich and C-rich reverse complement) were used in polymerase reactions. The number of DNA synthesis products terminated within the G- or C-rich motif and the immediately preceding sequences (Region A) was quantified and divided by those extended beyond the motif (Region B), a calculation termed PV. Reactions were chosen in which the polymerase: DNA ratios gave similar synthesis (20%–50%) in Regions A + B. (B) PVs when the G-rich strand is replicated by Polϵ and the C-rich strand is replicated by Polδ. Graph shows the PVs for 3–12 independent replicate reactions of all motifs examined. (C) PVs when the G-rich strand is replicated by Polδ and the C-rich strand is replicated by Polϵ. Graph shows the PVs for 4–9 independent replicate reactions of all motifs examined. Columns and error bars indicate mean and SEM. Statistics indicate mean PV significance when comparing complementary strands of a motif (short brackets) or when comparing the G-rich strand of a G4 motif to that of the Random Control (long brackets). Brown–Forsythe and Welch ANOVA with Dunnett’s T3 multiple comparisons tests used to analyze differences among pairwise data sets. ****P < 0.0001, ***P < 0.001, **P < 0.01, *P < 0.05.
Figure 5.
Figure 5.
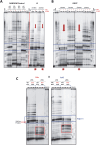
Hairpins formed on the C-rich strand are inhibitory to replicative holoenzymes. (A) Representative gel images of Polϵ and Polδ reactions using C-rich strand templates. Brackets and horizontal lines denote Region A. Polymerase pausing (arrows on gel) occurs at the base of a predicted hairpin preceding the C-rich motif, as shown in the most stable M-fold structure alongside each gel image. The hairpin contains part or all of the C-rich motif (beginning and end of C-rich motif indicated by thin arrows on M-fold structure). ΔG of each M-fold structure is indicated. Bases in M-fold structure that are single-stranded in all predicted structures are red, those that are double-stranded in all predicted structures are black, and bases of other colors show both single- and double-stranded character. Full gel images are in Supplementary Fig. S3. FER1L4 motif, Polδ:DNA molar ratios 0.05–0.5:1; Polϵ:DNA ratios 0.01–0.1:1 (increases indicated by arrows above gel). Replicate reactions are shown for the following motifs and Pol:DNA molar ratios: CCCA motif, Polϵ 0.1:1, Polδ 0.25:1; GGCCCC motif, Polϵ 0.3:1, Polδ 0.5:1; OGRE motif, Polϵ 0.1:1, Polδ 0.5:1. Triangles indicate an increase in reaction time from 5 to 15 min. TACG; sequencing ladder. (B) PVs for the C-rich strands. PVs were calculated for the region indicated in panel (A) for 2–5 independent reactions. Columns and error bars indicate mean and SEM. (C) CD spectra for each C-rich motif. Spectra were generated by sequentially adding reaction components: 1 mM Na-phosphate (blue), 40 mM Tris–HCl (pH 7.5, yellow), 8 mM MgOAc2 (green), 150 mM KCl (red), 1 mM DTT (light green), 200 μg/ml BSA (light blue), and 5% glycerol (pink), after 24 h (dashed pink). See Supplementary Fig. S7 for additional spectra. Predicted hairpin sequence is shown in red.
Figure 6.
Figure 6.
RPA reduces polymerase inhibition at hairpins but not at G4 structures. (A) Comparison of Polδ synthesis products using complementary strands of FER1L4, GGGT, and L1 motifs. RPA was loaded using Method A (see “Materials and methods” section) at the RPA:DNA molar ratios indicated. Polδ:DNA ratios were 0.1:1 (FER1L4 G-rich), 0.4:1 (FER1L4 C-rich, GGGT G-rich, GGGT C-rich), 0.2:1 (L1 G-rich), and 0.3:1 (L1 C-rich). All reactions were 15 min. No pol, control without polymerase and % Hyb, total amount of productively hybridized primer to template DNA. CG, sequencing ladder. Potential hairpin sequence in C-rich strand boxed in blue, G4 motif sequence boxed in red. (B) Polδ synthesis products of FER1L4 and L1 G-rich strands with increasing RPA:DNA ratios. RPA was loading using Method A and reactions were performed at both 0.1:1 and 0.5:1 Polδ: DNA for 15 min. No pol, % Hyb, and CG lanes are as defined in panel (A). Location of G4 motifs and preceding (Region A) are indicated by horizontal lines. Asterisks denote those reaction lanes in which addition of RPA becomes inhibitory to forward Polδ synthesis, as indicated by less primer usage or fewer long products.
Figure 7.
Figure 7.
PDS severely inhibits Polϵ and Polδ forward synthesis specifically on the G-rich strand. (A) Representative Polϵ and Polδ reactions on the Random Control G- and C-rich strands without and with addition of 0.5 μM PDS. Reactions for the L1 G4 motif were performed alongside the Random Control to confirm the G4-stabilizing activity of PDS. All reactions were performed for 15 min. Triangles indicate an increase in polymerase: DNA molar ratios (Random Control: Polϵ/G-rich strand 0.4–0.6:1; Polϵ/C-rich strand 0.8 –1.2:1; Polδ/G-rich strand 0.8–1.2:1; Polδ/C-rich strand 1–1.5:1; L1, Polϵ 0.2–0.6:1; Polδ 0.4–1:1). No pol, control without polymerase and % Hyb, total amount of productively hybridized primer to template. CG, sequencing ladder. Solid horizontal lines demarcate Region A. Vertical arrows indicate the decrease in reaction products extended beyond the G4 motif upon addition of PDS. Bursts indicate an increase in reaction products 10nt preceding the G4 motif and farther upstream upon addition of PDS. (B) Representative Polϵ and Polδ reactions on the GGGT G- and C-rich strands without and with addition of 0.5 μM PDS. Triangles indicate an increase in reaction time from 5 to 15 min. Polymerase:DNA molar ratios were as follows: 0.2:1 Polϵ/G-rich strand; 0.4:1 Polϵ/C-rich strand; 0.4:1 Polδ/G and C-rich strands. No pol, % Hyb, and CG lanes are as defined in panel (A). Lines, arrows, and bursts are as defined in panel (A). (C) Polϵ/δ forward polymerase activity is inhibited upon PDS treatment. Left panel, representative WT and PolϵDE (exonuclease-deficient Polϵ) synthesis reactions using the L1 G-rich strand without and with 0.5 μM PDS. WT Polϵ:DNA ratio was 0.2:1 and PolϵDE:DNA ratio ranged from 0.1 to 0.4:1 (arrow above gel). Triangles represent an increase in time from 5 to 15 min. TACG, sequencing ladder. Horizontal lines demarcate Region A. Horizontal arrow indicates WT Polϵ exonuclease activity causing increased products immediately preceding the G4. Boxed area indicates an increase in reaction products upstream of the G4 motif upon addition of PDS. Right panel, representative WT and PolδDV (exonuclease-deficient Polδ) synthesis reactions using the L1 G-rich strand without and with 0.5 μM PDS. WT Polδ: DNA ratio 0.4:1; PolδDV: DNA ratio 0.2–0.8:1 (arrow above gel). The same identifiers were used as in the left panel.
Figure 8.
Figure 8.
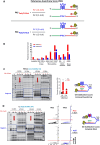
Polymerases display pronounced asynchrony in synthesis of complementary G-rich and C-rich strands. (A) Schematic of the PAS calculation when Polϵ (top) or Polδ (bottom) replicates the G-rich strand. To compare the differences in polymerase inhibition at the replication fork when Polϵ synthesizes the G-rich strand, the PAS was calculated as the ratio of the PV when Polϵ is on the G4 motif-containing strand versus that of Polδ on the C-rich strand. Likewise, asynchrony when Polδ synthesizes the G-rich strand was calculated as the ratio of the PV when Polδ is on the G4 motif-containing strand versus that of Polϵ on the C-rich strand. (B) PAS quantitation for all motifs examined, in both replication fork configurations. PAS was derived from the average of PVs of 3–12 independent reactions for each DNA strand. (C) PAS at a low stability G4 upon PDS treatment. Left panel: Representative Polϵ and Polδ reactions on G- and C-rich strands of FER1L4 with addition of 0.5 μM PDS. To allow DNA polymerase rebinding events during synthesis through a PDS stabilized G4, the polymerase: DNA ratios were increased such that the % synthesis in Regions (A + B) was >50% in reactions without PDS. Triangles indicate an increase in reaction time from 5 to 15 min. CG, sequencing ladder. Boxes demarcate the G- or C-rich motif and 10nt preceding the motif. Vertical arrows indicate the decrease in reaction products extended beyond the G4 motif upon addition of PDS. Image of full-length gel is in Supplementary Fig. S9B. Middle panel: Quantification of reaction products, with PDS (three replicates) and without PDS (1 replicate), when either Polϵ or Polδ is replicating the G-rich strand. Right panel: Schematic depicts the asynchrony at the replication fork, specifically when the G4 motif is stabilized by PDS and replicated by Polϵ. (D) PAS at a high stability G4 upon PDS treatment. Left panel: Gel image of Polϵ and Polδ reactions on the G- and C-rich strands of L1 upon addition of 0.5 μM PDS, with same identifiers as above in panel (C). Image of full-length gel is in Supplementary Fig. S9C. Middle panel: ImageQuant histograms showing the variation in polymerase reaction product band intensity (horizontal axis) with distance in the reaction lane (vertical axis) on the G-rich strand without and with PDS. Histograms begin with Region A and end with full length products. Polymerase synthesis proceeds from bottom to top. Horizontal line indicates the end of the G4 motif. Right panel: Schematic depicts a complete block on the G4 motif-containing strand, causing replication fork asynchrony that is incalculable and can occur at the 7057 known L1 sites in the genome.

Similar articles

References

    1. Tomasetti C, Li L, Vogelstein B Stem cell divisions, somatic mutations, cancer etiology, and cancer prevention. Science. 2017; 355:1330–4.10.1126/science.aaf9011. - DOI - PMC - PubMed
    1. Hoyt SJ, Storer JM, Hartley GA et al. . From telomere to telomere: the transcriptional and epigenetic state of human repeat elements. Science. 2022; 376:eabk3112.10.1126/science.abk3112. - DOI - PMC - PubMed
    1. Guiblet WM, Cremona MA, Harris RS et al. . Non-B DNA: a major contributor to small- and large-scale variation in nucleotide substitution frequencies across the genome. Nucleic Acids Res. 2021; 49:1497–516.10.1093/nar/gkaa1269. - DOI - PMC - PubMed
    1. López Castel A, Cleary JD, Pearson CE Repeat instability as the basis for human diseases and as a potential target for therapy. Nat Rev Mol Cell Biol. 2010; 11:165–70.10.1038/nrm2854. - DOI - PubMed
    1. Makova KD, Weissensteiner MH Noncanonical DNA structures are drivers of genome evolution. Trends Genet. 2023; 39:109–24.10.1016/j.tig.2022.11.005. - DOI - PMC - PubMed

LinkOut - more resources