. 2025 Jun;12(22):e2416590.
doi: 10.1002/advs.202416590. Epub 2025 Apr 29.

Nuclear-Localized BCKDK Facilitates Homologous Recombination Repair to Support Breast Cancer Progression and Therapy Resistance

Affiliations

Nuclear-Localized BCKDK Facilitates Homologous Recombination Repair to Support Breast Cancer Progression and Therapy Resistance

Haiying Liu et al. Adv Sci (Weinh). 2025 Jun.

Abstract

Homologous recombination repair (HRR) is crucial for maintaining genomic stability by repairing DNA damage. Despite its importance, HRR's role in cancer progression is not fully elucidated. Here, this work shows that nuclear-localized branched-chain α-ketoacid dehydrogenase kinase (BCKDK) acts as a modulator of HRR, promoting cell resistance against DNA damage-inducing therapy in breast cancer. Mechanistically, this work demonstrates that BCKDK is localized in the nucleus and phosphorylates RNF8 at Ser157, preventing the ubiquitin-mediated degradation of RAD51, thereby facilitating HRR-mediated DNA repair under replication stress. Notably, aberrant expression of the BCKDK/p-RNF8/RAD51 axis correlates with breast cancer progression and poor patient survival. Furthermore, this work identifies a small molecule inhibitor of BCKDK, GSK180736A, that disrupts its HRR function and exhibits strong tumor suppression when combined with DNA damage-inducing drugs. Collectively, this study reveals a new role of BCKDK in regulating HRR, independent of its metabolic function, presenting it as a potential therapeutic target and predictive biomarker in breast cancer.

Keywords: BCKDK; DNA repair inhibitor; breast cancer; combinational therapy; homologous recombination repair.


Conflict of interest statement

The authors declare no conflict of interest.

Figures
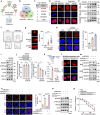
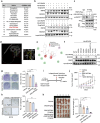
Figure 1
Figure 1
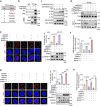
Branched‐chain α‐ketoacid dehydrogenase kinase (BCKDK) localizes in the nucleus to facilitate DNA damage repair and homologous recombination repair (HRR) in breast cancer. a) Schematic diagram for screening key genes regulating DNA damage repair. We used three triple‐negative breast cancer (TNBC) cell lines, SUM149PT, MDA‐468 and MDA‐231 in the screening experiment. Selection of these cell lines was based on their distinct genetic backgrounds and varying responses to treatment. b) Venn diagram of nuclear proteomics analysis showing the overlap of genes enriched in three groups. The red, green, and blue circles represent gene enrichment in the MDA‐468, MDA‐231, and SUM149PT cell lines, respectively. c) List of top five ranked overlapping genes in (b). d) Immunofluorescence (IF) staining of MDA‐468, and MDA‐231 cell lines and breast cancer organoids with BCKDK antibody (red) and DAPI (blue). Scale bars, 5 µm in cell lines and 10 µm in organoids (BCO1 and BCO2 were derived from patients with Luminal B breast cancer). e) Western blot analysis of BCKDK in nuclear fractions of MDA‐468, MDA‐231, and SUM149PT cells treated with Olaparib at the concentrations of 0, 25, 50, and 100 × 10−6 m for 48 h. f) Representative images showing increased genomic instability in MDA‐468 cells stably expressing nontargeting control vectors (NTC) or BCKDK shRNAs. Scale bar, 50 µm. g) Comet assay shows the tail moment of MDA‐468 cells stably expressing BCKDK shRNAs (sh1 and sh2) or NTC. Representative images are shown on the left, with the number of tail moment cells quantified on the right. Scale bars, 10 µm. h) γH2A.X foci (red) and DAPI (blue) visualized by IF microscopy in NTC or shBCKDK expressing MDA‐468 cells. Representative images are shown on the left, with the number of foci per cell quantified on the right. Scale bar, 5 µm. i)Western blot analysis of BCKDK, Ku70, p‐RPA32, RPA32, γH2A.X, and H2A.X levels in MDA‐468 cells stably expressing NTC or BCKDK shRNAs (sh1 and sh2). j) Analysis of *** nonhomologous end joining (NHEJ) and HRR efficiency in U2OS cells expressing NTC or BCKDK shRNAs (sh1 and sh2) by using DSB repair reporter (DRR) system. k) Chromatin immunoprecipitation (ChIP) analyses with the indicated antibodies were performed at the indicated for 48 h after I‐SceI transfection in overexpressing DR‐GFP U2OS cells. The indicated primers covering a range of distances from the cutting open site were used for the PCR. l) IF staining with an BCKDK antibody (red) and DAPI (blue) in endogenous BCKDK knockdown MDA‐468 cells, followed by transfected with BCKDKNLS‐WT or BCKDKNLS‐Mut vectors. Scale bar, 5 µm. m–p)MDA‐468 cells stably expressing NTC or BCKDK shRNAs were further transfected with BCKDKNLS‐WT, BCKDKNLS‐Mut, or control vectors. Each group of cells was followed by the experiments described below. Western blot analysis of BCKDK levels in the fraction of nuclear (Nuc), cytosolic (Cyto), and whole cell lysate (WCL). Lamin B, GAPDH and β‐actin were used to verify each fraction (m). IF staining of each group of cells with γH2A.X foci (red) and DAPI (blue). Representative images are shown on the left, with the number of foci per cell quantified on the right. Scale bar, 5 µm (n). Western blot analysis of cellular BCKDK, Ku70, p‐RPA32, and RPA32 levels (o). CCK8 assay determines the IC50 of Olaparib (Ola) treatment over 48 h (p). Western blots are representative of three independent experiments (e,i,j,m,o). Error bars denote mean ± S.D. or mean ± S.E.M. (g,h,j,n,p). Statistical analyses were performed by two‐tailed Student's t‐test (p). Statistical analyses were performed by one‐way ANOVA with Tukey's multiple comparisons test (g,h,j,n). Lamin B, GAPDH, H2A.X, and β‐actin serve as loading control in the Western blot. * p < 0.05, ** p < 0.01, or *** p < 0.001 as compared to corresponding group.
Figure 2
Figure 2
Branched‐chain α‐ketoacid dehydrogenase kinase (BCKDK) binds with and phosphorylates RNF8 at S157 to modulate homologous recombination repair (HRR). a) Immunoprecipitation‐mass spectrometry (IP‐MS) analysis of nuclear proteins interacting with BCKDK in Flag‐BCKDK overexpressed MDA‐468 cells. The top five rated DNA damage repair proteins are listed. b) Co‐IP assay in MDA‐468 cells co‐transfected with HA‐BCKDK and Flag‐tagged RNF8. Cell lysates were immunoprecipitated with Flag antibody, followed by Western blot analysis with antibodies against HA or Flag. c) In vitro kinase assay analysis of GST‐RNF8 phosphorylation in the absence or presence of His‐BCKDK by adding ATP at the indicated concentrations. d) MDA‐468 cells stably expressing nontargeting control vectors (NTC) or BCKDK shRNAs were transfected with Flag‐RNF8WT, Flag‐RNF8S157A, or Flag‐RNF8S157D vectors. Cells were harvested and subjected to IP with Flag antibody, followed by Western blot to detect p‐RNF8S157, Flag, and BCKDK levels. e) Immunofluorescence (IF) staining with γH2A.X foci (red) and DAPI (blue) in MDA‐468 cells stably expressing NTC or RNF8 shRNAs, followed by transfected with RNF8WT, RNF8S157A, RNF8S157D, or control vectors. Representative images are shown on the left, with the number of foci per cell quantified on the right top, Western blot analysis of RNF8 and p‐RNF8S157 was shown on the right bottom. Scale bar, 5 µm. f) HRR efficiency levels were tested via I‐Scel HRR system in U2OS cells stably expressing NTC or RNF8 shRNAs, followed by transfected with RNF8WT, RNF8S157A, RNF8S157D, or control vectors. g) IF staining with γH2A.X foci (red) and DAPI (blue) in MDA‐468 cells stably expressing BCKDK and NTC or RNF8 shRNAs, followed by transfected with RNF8WT, RNF8S157A, RNF8S157D, or control vectors. Representative images are shown on the left, with the number of foci per cell quantified on the right top, Western blot analysis of RNF8, p‐RNF8S157, and BCKDK was shown on the right bottom. Scale bar, 5 µm. h) HRR efficiency levels were tested via I‐Scel HRR system in U2OS cells stably expressing BCKDK and NTC or RNF8 shRNAs, followed by transfected with RNF8WT, RNF8S157A, RNF8S157D, or control vectors. Western blots are representative of three independent experiments (b,c,d,e,g). Error bars denote mean ± S.D. or mean ± S.E.M. (e,f,g,h). Statistical analyses were performed by one‐way ANOVA with Tukey's multiple comparisons test (e,f,g,h). β‐actin serves as loading control in the Western blot. * p < 0.05, ** p < 0.01, or *** p < 0.001 as compared to corresponding group.
Figure 3
Figure 3
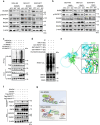
Branched‐chain α‐ketoacid dehydrogenase kinase (BCKDK) phosphorylates RNF8 at S157 to prevent ubiquitin‐mediated RAD51 degradation. a) Western blot analysis of BCKDK, p‐RNF8S157, RAD50, RAD51, and RAD52 levels in MDA‐468, MDA‐231, and SUM149PT cells transfected with nontargeting control vectors (NTC) or shBCKDK (sh1 or sh2). b) Western blot analysis of RNF8, p‐RNF8S157, RAD50, RAD51, and RAD52 levels in MDA‐468 MDA‐231, and SUM149PT cells transfected with NTC or shRNF8 (sh1 or sh2). c) Flag‐RAD51 and HA‐tagged ubiquitin (HA‐Ub) expressing HEK293T cells transfect with BCKDK shRNAs, RNF8 shRNAs, V5‐RNF8WT, V5‐RNF8S157A, V5‐RNF8S157D, or control vectors for 48 h, followed by treating with 10 × 10−6 m MG132 for 8 h before collection. Immunoprecipitation was performed by using anti‐Flag antibody or IgG. Polyubiquitination of Flag‐RAD51 were detected by Western blot. d) In vitro ubiquitination assay, substrate (RAD51) was incubated with ubiquitin activating enzyme (E1 in kit), UBC13 (E2) and GST‐RNF8WT, GST‐RNF8S157A or GST‐RNF8S157D (E3) along with Mg2+ and ATP. e) Diagram illustrating the amino acid residues of RAD51 bound to RNF8 by Alphafold 3 and Pymol. Green ribbon representation of the RAD51, blue ribbon representation of RNF8. f) Western blot analysis of RNF8, BCKDK, and RAD51 proteins in chromatin fractions or whole cell lysis (WCL) of MDA‐468 cells stably expressing BCKDK and NTC or RNF8 shRNAs, followed by transfected with Flag‐RNF8WT, Flag‐RNF8S157A, Flag‐RNF8S157D, or control vectors. g) A schematic illustrating how BCKDK binds to and phosphorylates RNF8, which in turn protects RAD51 from ubiquitin‐mediated proteasomal degradation on the chromatin. Western blots are representative of three independent experiments (a,b,c,d,f). β‐actin and H2A.X serve as loading control in the Western blot.
Figure 4
Figure 4
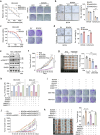
The branched‐chain α‐ketoacid dehydrogenase kinase (BCKDK) mediated RNF8 phosphorylation contributes to resistance against DNA damage‐inducing drugs in breast cancer. a) The IC50 values of Olaparib (Ola) treatment over 48 h (left), and colony formation with or without 1 × 10⁻⁶ m Olaparib treatment for 14 days (right) were examined in MDA‐468 cells stably expressing nontargeting control vectors (NTC) or shBCKDK (sh1, sh2). b) Breast cancer organoid BCO4 stably expressing NTC or BCKDK shRNAs (sh1 and sh2) were treated with or without DNA damage agent 0.1 × 10⁻⁶ m Adriamycin for 6 days. Representative micrographs were shown (left) and relative cell viability were analyzed (right). Scale bar, 50 µm. c) The IC50 values of Olaparib (Ola) treatment over 48 h (left), and colony formation with or without 1 × 10⁻⁶ m Olaparib treatment for 14 days (right) were determined in MDA‐468 cells stably expressing EV or BCKDK. d) Breast cancer organoids (BCO4) stably expressing EV or BCKDK were treated with or without 0.1 × 10⁻⁶ m Adriamycin for 6 days. Representative micrographs were shown (left) and relative cell viability were analyzed (right). Scale bar, 50 µm. e) Nuclear Western blotting analysis of BCKDK, RNF8, p‐RNF8S157, and RAD51 levels in Olaparib resistant MDA‐468 cells stably expressing NTC or BCKDK shRNAs. f,g) MDA‐468 cells stably expressing NTC or BCKDK shRNAs were subcutaneously injected in BALB/c nude mice following treatment with 25 mg kg−1 Olaparib or vehicle (n = 5 per group). Tumor growth (f), tumor images (g, left), and tumor mass (g, right) were measured at the experiment. h,i) MDA‐468 or MDA‐231 cells stably expressing BCKDK or RNF8 shRNAs were transfected with Flag‐RNF8WT, Flag‐RNF8S157A, Flag‐RNF8S157D, or control vectors, IC50 of Olaparib (Ola) treatment over 48 h (h) and colony formation with or without 1 × 10⁻⁶ m Olaparib treatment for 14 days (i) were determined. j,k) BCKDK overexpression and RNF8 knockdown MDA‐468 cells transfected with Flag‐RNF8WT, Flag‐RNF8S157A, Flag‐RNF8S157D, or control vectors were subcutaneously injected in BALB/c nude mice, following treatment with 25 mg kg−1 Olaparib or vehicle (n = 5 per group). Tumor growth (j), tumor images (k, left), and tumor mass (k, right) were measured at the experiment. Western blots are representative of three independent experiments (e). Error bars denote mean ± S.D. or mean ± S.E.M. (a,b,c,d,f,g,h,j,k). Statistical analyses were performed by two‐tailed Student's t‐test (a,c), one‐way or two‐way ANOVA with Tukey's multiple comparisons test (b,d,f,g,h,j,k). β‐actin and H3 serves as loading control in the Western blot. * p < 0.05, ** p < 0.01, or *** p < 0.001 as compared to corresponding group. n.s., not significant.
Figure 5
Figure 5
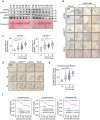
Aberrant branched‐chain α‐ketoacid dehydrogenase kinase (BCKDK)/p‐RNF8S157/RNF8 axis predicts breast cancer progression and mortality. a) Western blot analysis of BCKDK, p‐RNF8S157, RNF8, and RAD51 levels in 14 pairs of clinically matched with tumor‐adjacent noncancerous tissues (N) and breast cancer tissues (T). b) Representative immunohistochemistry (IHC) images showing BCKDK, p‐RNF8S157, or RNF8 levels in normal breast tissue (normal) and breast cancer specimens of different clinical stages (I‐III). Scale bars, 50 µm. Insets, fourfold magnification; scale bars, 20 µm. c) Statistical quantification of the mean intensity of BCKDK (c, left), and p‐RNF8S157(c, right) staining using HistoQuest software (healthy donors (N), n = 8; patients with breast cancer, stage I (n = 34), II (n = 50), and III (n = 19)). d) Representative IHC images of BCKDK, p‐RNF8S157, p‐RPA32, or RAD51 staining in the consecutive sections from breast cancer patients. Scale bars, 50 µm. e) Statistical quantification of the mean intensity of nuclear‐localized BCKDK staining using HistoQuest software (healthy donors (N), n = 8; patients with breast cancer, stage I (n = 34), II (n = 50), and III (n = 19)). f) Univariate Kaplan–Meier analysis of patients with low versus high levels of BCKDK, nuclear‐localized BCKDK, and p‐RNF8S157. Western blots are representative of three independent experiments (a). Error bars denote mean ± S.D. or mean ± S.E.M. c,e). Statistical analyses were performed by one‐way ANOVA with Tukey's multiple comparisons test (c,e) or log‐rank test (f). Ponceau S served as a loading control. * p < 0.05, ** p < 0.01, or *** p < 0.001 as compared to corresponding group.
Figure 6
Figure 6
Branched‐chain α‐ketoacid dehydrogenase kinase (BCKDK) inhibition by a selective inhibitor sensitizes breast cancer cells to DNA damage‐inducing therapy. a) GST‐RNF8 and His‐BCKDK were treated with 30 × 10−6 m 72 kinase inhibitors in vitro and kinase reaction inhibition efficiency was measured by the ADP‐Glo Max assay. Top 14 kinase inhibitors were listed. b) Pull‐down assay of His‐BCKDK by GST‐RNF8 using proteins purified in E. coli, following by treatment with kinase inhibitors shown in (a). c) MDA‐468 cells stably expressing Flag‐RNF8 were treated with or without GSK180736A at the indicated concentrations for 24 h, cells were harvested and subjected to immunoprecipitation with Flag antibody, followed by Western blot to detect p‐RNF8S157 and Flag‐ RNF8 levels. d) Diagram illustrating GSK180736A bound to BCKDK. The structures of BCKDK and GSK180736A were used for the modeling using Discovery Studio. Gray ribbon representation of the BCKDK, yellow stick representation of GSK180736A. e) Two‐dimensional (2D) diagram showed the amino acid residues of BCKDK bound to GSK180736A, different colors indicated different intermolecular interactions. f) GST pull down of GST‐RNF8 by His‐BCKDK‐WT, ‐K233A, ‐W234A, ‐F237A, ‐R240A, ‐L241A, ‐D270A&Y271A, ‐P274A, or ‐Q359A was performed using E. coli purified proteins. g) Colony formation assay was performed in MDA‐468 cells treated with GSK180736A (4 × 10⁻⁶ m), Olaparib (Ola, 1 × 10⁻⁶ m), or a combination of both drugs for 14 days. Crystal violet staining (left) and quantitative analysis of the parallel dishes evaluated (right) on 6 days. h) Cell viability was assayed in breast cancer organoids (BCO4) treated with GSK180736A (4 × 10⁻⁶ m), Adriamycin (0.1 × 10⁻⁶ m), or a combination of both drugs for 6 days. Representative micrographs were shown (left) and relative cell viability were analyzed (right). i–k) Intraperitoneal injections of GSK180736A (1 mg kg−1 every 3 days), Olaparib (25 mg kg−1 every 3 days), or a combination of both drugs were administered to the mice of MMTV‐PyMT TNBC model. All the mice were sacrificed at 11 weeks. A schematic diagram is shown (i). Tumor growth rates were recorded after 7 days of drug administration (j). Representative images of tumors (k, left) and the quantification of breast fat pad weight (k, right) were measured at the end of the experiment. Western blots are representative of three independent experiments (b,c,f). Error bars denote mean ± S.D. or mean ± S.E.M. (a,g,h,j,k). Statistical analyses were performed by one‐way ANOVA with Tukey's multiple comparisons test (a,g,h,j,k). β‐actin served as a loading control. * p < 0.05, ** p < 0.01, or *** p < 0.001 as compared to corresponding group.

Similar articles

References

    1. Chapman J. R., Taylor M. R. G., Boulton S. J., Mol. Cell 2012, 47, 497. - PubMed
    1. Harper J. W., Elledge S. J., Mol. Cell 2007, 28, 739. - PubMed
    1. Hosea R., Hillary S., Naqvi S., Wu S. R., Kasim V., Signal Transduction Targeted Ther. 2024, 9. - PMC - PubMed
    1. Halazonetis T. D., Gorgoulis V. G., Bartek J., Science 2008, 319, 1352. - PubMed
    1. Bartkova J., Rezaei N., Liontos M., Karakaidos P., Kletsas D., Issaeva N., Vassiliou L. V. F., Kolettas E., Niforou K., Zoumpourlis V. C., Takaoka M., Nakagawa H., Tort F., Fugger K., Johansson F., Sehested M., Andersen C. L., Dyrskjot L., Orntoft T., Lukas J., Kittas C., Helleday T., Halazonetis T. D., Bartek J., Gorgoulis V. G., Nature 2006, 444, 633. - PubMed

LinkOut - more resources