. 2025 May;12(20):e2412553.
doi: 10.1002/advs.202412553. Epub 2025 Apr 29.

SIRT4 Promotes Pancreatic Cancer Stemness by Enhancing Histone Lactylation and Epigenetic Reprogramming Stimulated by Calcium Signaling

Affiliations

SIRT4 Promotes Pancreatic Cancer Stemness by Enhancing Histone Lactylation and Epigenetic Reprogramming Stimulated by Calcium Signaling

Mengzhu Lv et al. Adv Sci (Weinh). 2025 May.

Abstract

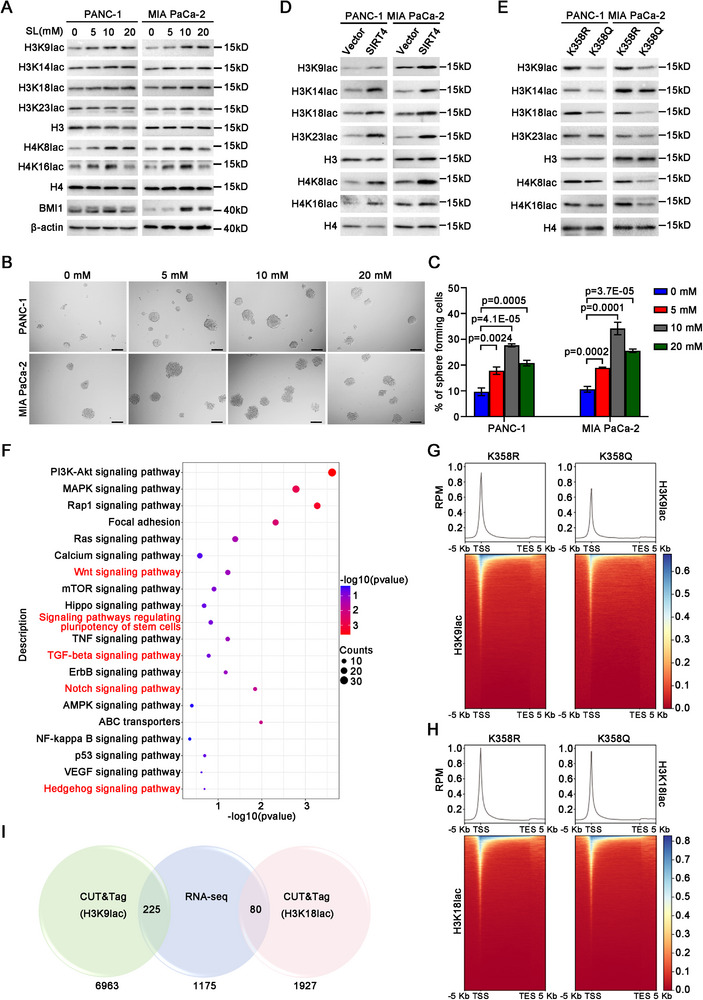
Mitochondria Sirtuins including SIRT4 erase a variety of posttranslational modifications from mitochondria proteins, leading to metabolic reprogramming that acts as a tumor suppressor, oncogenic promotor, or both. However, the factors and the underlying mechanisms that stimulate and relay such a signaling cascade are poorly understood. Here, we reveal that the voltage-gated calcium channel subunit α2δ1-mediated calcium signaling can upregulate the expression of SIRT4, which is highly expressed in α2δ1-positive pancreatic tumor-initiating cells (TICs). Furthermore, SIRT4 is functionally sufficient and indispensable to promote TIC properties of pancreatic cancer cells by directly deacetylating ENO1 at K358, leading to attenuated ENO1's RNA-binding capacity, enhanced glycolytic substrate 2-PG affinity, and subsequently robust catalytic activity with boosted glycolytic ability and increased production of lactate acid. Interestingly, both SIRT4 and deacetylated mimetic of ENO1-K358 can increase the lactylation of histones at multiple sites including H3K9 and H3K18 sites, which resulted in epigenetic reprogramming to directly activate a variety of pathways that are essential for stemness. Hence, the study links α2δ1-mediated calcium signaling to SIRT4-mediated histone lactylation epigenetic reprogramming in promoting the stem cell-like properties of pancreatic cancer, which holds significant potential for the development of novel therapeutic strategies by targeting TICs of pancreatic cancer.

Keywords: SIRT4; glycolysis; histones lactylation; tumor‐initiating cells.


Conflict of interest statement

The authors declare no conflict of interest.

Figures

Figure 1
Figure 1
SIRT4 is upregulated by α2δ1‐triggered calcium signaling. A) Volcano plot of differentially expressed genes (|log2(fold change)| >1.5, FDR < 0.05) as revealed by RNA‐seq in PANC‐1 cells overexpressing α2δ1 and vector alone control. B) The expression of SIRT4 and α2δ1 in the indicated cells overexpressing α2δ1 as detected by qRT‐PCR (n = 3). C) Western blot results demonstrating the expression of the indicated molecules in the indicated cells overexpressing α2δ1. D) The change of SIRT4 mRNA in the indicated cells after knockdown of α2δ1 with shRNAs as measured by qRT‐PCR (n = 3). E) Western blot analysis of the indicated molecules in the sorted α2δ1¯ and α2δ1+ fractions from the indicated sources. F) Western blot results demonstrating the expression of SIRT4 in the indicated cells treated with KN93 or cyclosporin (CsA) for 48 h. G) qRT‐PCR results showing the expression of SIRT4 after knockdown of CaMK2D in the indicated cells overexpressing α2δ1 (n = 3). H) Western blot analysis of SIRT4 in the indicated cells infected with lentivirus harboring CaMK2D shRNAs or scramble control. I) The expression of SIRT4 in the indicated cells overexpressing α2δ1 treated with verteporfin for 24 h as measured by qRT‐PCR (n = 3). J) Western blot results showing the expression of SIRT4 in the indicated cells overexpressing α2δ1 treated with verteporfin for 24 h. β‐actin served as an internal reference in B, D, G, and I. Data were presented as mean ± SD. Unpaired two‐tailed Student's t‐test was used for statistical analysis.
Figure 2
Figure 2
SIRT4 promotes the stem cell‐like properties of PDAC. A,B) Quantitative RT‐PCR analysis of the expression of the indicated genes in α2δ1+ PANC‐1 cells (A) and MIA PaCa‐2 cells (B) after SIRT4 knockdown with its specific shRNAs (n = 3). β‐actin served as an internal reference. C) Western blot analysis of the expression of the indicated molecules in purified α2δ1+ subsets from the indicated sources after SIRT4 knockdown with shRNAs. D) Representative phase contrast micrographs showing the spheroids formed by α2δ1+ cells sorted from the indicated sources following knockdown the expression of SIRT4 by specific shRNAs. Scale bars, 100 µm. E) Histograms showing the effect of SIRT4 knockdown on the spheroid formation capacity of FACS‐sorted α2δ1+ subsets from the indicated sources. Cells were seeded in 96‐well plates at 100 cells per well (n = 6). F) Photographs showing the dissected tumors formed by the indicated α2δ1+ cells infected with the indicated lentiviruses. Scale bars, 1 cm. G) Western blot analysis of the expression of the indicated molecules in FACS‐purified α2δ1¯ cells overexpressing the indicated constructs. H) Representative phase contrast micrographs showing the spheroids formed by α2δ1¯ cells overexpressing the indicated constructs. Scale bars, 100 µm. I) Histograms showing the spheroid formation efficiencies in the indicated α2δ1¯ cells overexpressing the indicated constructs. Cells were plated at 100 cells per well in 96‐well plates (n = 3). J) Photographs showing the dissected tumors formed in NOD/SCID mice injected s.c. with the indicated α2δ1¯ cells overexpressing the indicated constructs. Scale bars, 1 cm. Data in A, B, E, and I were the mean ± SD of three independent experiments. Unpaired two‐tailed Student's t‐test was used for statistical analysis.
Figure 3
Figure 3
SIRT4 interacts with ENO1 in PDAC cells. A) SDS‐PAGE analysis of the immunoprecipitated products with FLAG‐resin in PANC‐1 cells overexpressing SIRT4‐FLAG construct. Precipitated products in the cells transfected with vector alone serve as a control. Representative candidates of each band identified by mass spectrum are shown. B,C) Western blot analysis with the indicated antibodies of the immunoprecipitation products by the antibody against HA (B) or FLAG (C) from HEK293T cells transfected with HA‐tagged SIRT4 and FLAG‐tagged ENO1 constructs. D) Western blot analysis of the immunoprecipitated products by the indicated antibodies in the PANC‐1 cell line. E) Confocal micrographs showing the subcellular location of SIRT4 protein in PANC‐1 cells. Mito tracker was used to visualize mitochondria and nuclei were stained with DAPI. The white arrows indicating SIRT4 outside the mitochondria. Scale bars, 5 µm. F) Confocal images showing the subcellular location of ENO1 and SIRT4 protein in PANC‐1 cells. DAPI was used to stain nuclei. Scale bars, 5 µm. G) Western blot results demonstrating the change of the acetylated level of the immunoprecipitated ENO1 in α2δ1¯ PANC‐1 cells after SIRT4 overexpression. H) ENO1 was immunoprecipitated from the cell lysates of α2δ1¯ PANC‐1 cells infected with vector alone or SIRT4‐overexpressing lentivirus and was separated by SDS‐PAGE for acetylation analysis by mass spectrum. I) The list of the acetylated lysine sites of ENO1 in the α2δ1¯ PANC‐1 cells infected with the lentivirus harboring empty vector or SIRT4‐expressing cassette identified by mass spectrometry.
Figure 4
Figure 4
The deacetylation of ENO1 at K358 promotes stem cell‐like traits in PDAC cells. A) Western blot results showing the expression of the indicated molecules in the ENO1‐knockout (ENO1‐KO) cell lines expressing the indicated sgRNA‐resistant constructs. B) Representative images demonstrating the spheroid formed by the indicated cells. Scale bars, 100 µm. C) Histograms showing the spheroid formation efficiencies of the cells expressing each of the indicated ENO1 mutants. Cells were plated at 100 cells/well in 96‐well plates (n = 6). D) Photograph demonstrating the dissected tumors formed in NOD/SCID mice by transplanting 1000 cells of the indicated cells at each site. Scale bars, 1 cm. E,F) Western blot results showing the expression of the indicated molecules in the ENO1‐KO PANC‐1 (E) and MIA PaCa‐2 (F) cells expressing wild‐type ENO1(WT) or ENO1K358Q (K358Q) mutant after forced expression of SIRT4. G) Representative phase contrast micrographs demonstrating the spheres formed by the ENO1‐KO PANC‐1 cells expressing wild‐type ENO1(WT) or ENO1K358Q (K358Q) mutant after forced expression of SIRT4. Cells were seeded at 100 cells/well in 96‐well plates (n = 6). Scale Bars, 50 µm. H) Histograms showing the spheroid formation efficiencies of the indicated ENO1‐KO cells expressing wild‐type ENO1(WT) or ENO1K358Q (K358Q) mutant after forced expression of SIRT4. Data in (C) and (H) are presented as mean ± SD of three independent experiments. Unpaired two‐tailed Student's t‐test was used for statistical analysis.
Figure 5
Figure 5
ENO1 is deacetylated at K358 by SIRT4 in PDAC. A) Western blot analysis of the immunoprecipitated FLAG‐ENO1 by FLAG‐resin from HEK293T cells which was transiently transfected with FLAG‐ENO1 construct, followed by the treatment with the indicated reagents. TSA (10 µm), NAM (10 µm). B) In vitro deacetylation assay showing the deacetylation of ENO1 at K358 by SIRT4. The recombinant ENO1 was incubated with purified SIRT4 in the deacetylation assay buffer, and the ENO1 K358 acetylation level was analyzed by Western blotting. C) Western blot results demonstrating the acetylation status of ENO1 at K358 in sorted α2δ1¯ and α2δ1+ fractions from the indicated sources. D) The acetylation levels of ENO1‐ K358 in the indicated cells overexpressing α2δ1 as detected by Western blot. E) Western blot results showing the acetylation levels of ENO1‐K358 in the indicated α2δ1¯ cells overexpressing SIRT4 or mutant SIRT4H161Y. F) Western blot results demonstrating the expression of the indicated molecules in 20 pairs of tumor tissues (T) and adjacent normal tissues (N) from PDAC patients.
Figure 6
Figure 6
The deacetylation of ENO1‐K358 enhances the enzymatic activity of ENO1 and glycolysis. A) Histograms demonstrating the enzymic activity of ENO1 in the ENO1‐KO cells overexpressing the indicated sgRNA‐resistant constructs (n = 3). B) Flow cytometry analysis for glucose uptake capacity using a fluorescence‐labeled glucose analogue, 2‐NBDG. Histograms showing the 2‐NBDG uptake rate of each ENO1 mutant in the indicated ENO1‐KO cells (n = 3). C,D) Histograms representing the secreted (C) and intercellular (D) lactate production of the ENO1 mutants in the indicated ENO1‐KO cell line (n = 3). E,F) The ECAR curve (E) and histograms (F) exhibiting the changes of glycolysis, glycolytic capacity, and glycolytic reserve in ENO1‐KO PANC‐1 cells overexpressing the indicated constructs (n = 5). G,H) The OCR curve (G) and histograms (H) demonstrating the changes in basal respiration, spare respiratory capacity, and ATP production in PANC‐1 cells expressing specific ENO1 mutants (n = 5). Abbreviations: A, antimycin A; F, FCCP; Glc, glucose; O, oligomycin; R, rotenone. Data were presented as mean ± SD. Unpaired two‐tailed Student's t‐test was used for statistical analysis.
Figure 7
Figure 7
SIRT4 enhances glycolysis and its deacetylation of ENO1‐K358 attenuates the binding of ENO1 to SNORA25. A) Line graphs showing the effects of SIRT4 on the enzymic activity of ENO1 in the indicated α2δ1¯ cells (n = 3). B) Histograms showing the fold change of the enzymic activity of ENO1 after forced expression of SIRT4 in the sorted α2δ1¯ cells from the indicated cell lines (n = 3). C,D) The secreted (C) and intercellular (D) lactate production were determined in the indicated α2δ1¯cells overexpressing SIRT4 (n = 3). E) ECAR curve showing the changes of glycolysis of α2δ1¯ PANC‐1 cells after forced expression of SIRT4 (n = 5). F) Histograms showing the changes of glycolysis, glycolytic capacity, and glycolytic reserve following forced expression of SIRT4 in α2δ1¯ PANC‐1 cells (n = 5). G) OCR curve showing the change of mitochondrial respiration of α2δ1¯ PANC‐1 cells after forced expression of SIRT4 (n = 5). H) Histograms showing the changes in basal respiration, spare respiratory capacity, and ATP production following forced expression of SIRT4 in α2δ1¯ PANC‐1 cells (n = 5). I) The steady‐state affinity (binding at equilibrium) of purified wild‐type ENO1, ENO1K358R, ENO1K358Q protein with substrate 2‐PG as measured by SPR assay. J) Global RIP‐seq map of bound RNA for wild‐type ENO1, ENO1K358R, and ENO1K358Q mutants in the ENO1‐KO PANC‐1 cells expressing the respective sgRNA‐resistant mutants. K) Pie chart showing the distribution proportion of RNAs bound by ENO1K358Q vs ENO1K358R, based on the RIP‐seq data in (J). L) Quantitative RT‐PCR results of SNORA48, SNORA73B and SNORA25 after RIP in the ENO1‐KO PANC‐1 cells expressing the respective sgRNA‐resistant mutants (n = 3). β‐actin was used as an internal reference. M) Western blot analysis of the immunoprecipitated products by SNORA25 from the mixtures of purified ENO1K358R, ENO1K358Q protein with biotinylated labeled SNORA25 and 2‐PG. Data in B, C, D, F, H, and L were presented as mean ± SD. Unpaired two‐tailed Student's t‐test was used for statistical analysis.
Figure 8
Figure 8
SIRT4‐mediated deacetylation of ENO1‐K358 leads to histone lactylation and epigenetic reprogramming. A) Western blot results showing the lactylation of histones and the expression of the indicated molecules in the indicated cells treated with sodium lactate (SL) for 48 h. B) Representative micrographs showing the spheres formed by the indicated cells treated with sodium lactate. Scale bars, 100 µm. C) Histograms showing the spheroid forming efficiencies of the indicated cells treated with sodium lactate (n = 6). Data were the mean ± SD of three independent experiments. Unpaired two‐tailed Student's t‐test was used for statistical analysis. D) Immunoblotting results showing the effects of SIRT4 on the lactylation of histones as detected by Western blot in the indicated cells overexpressing SIRT4. E) Western blot results showing the lactylation of histones at the indicated lysine residues in the indicated cells. F) Top pathways (FDR<0.05) identified by KEGG enrichment analysis among the up‐regulated genes in MIA PaCa‐2 cells overexpressing ENO1‐K358R compared with the ENO1‐K358Q ones. G,H) Metaplots and heatmaps showing the occupancy of genome‐wide H3K9lac and H3K18lac binding peaks in a ± 5 kb window surrounding the transcription start sites (TSS) and transcription end sites (TES) in ENO1K358R MIA PaCa‐2 and ENO1K358Q ones. I) Venn diagram showing the overlapped candidate genes upregulated by lactylated H3K9 or H3K18 in CUT&Tag and RNA‐seq data of ENO1K358R MIA PaCa‐2 cells versus ENO1K358Q ones.

References

    1. Prager B. C., Xie Q., Bao S., Rich J. N., Cell Stem Cell 2019, 24, 41. - PMC - PubMed
    1. Clarke M. F., Dick J. E., Dirks P. B., Eaves C. J., Jamieson C. H., Jones D. L., Visvader J., Weissman I. L., Wahl G. M., Cancer Res. 2006, 66, 9339. - PubMed
    1. Chien H. J., Ying T. H., Hsieh S. C., Lin C. L., Yu Y. L., Kao S. H., Hsieh Y. H., J. Cell. Physiol. 2020, 235, 5590. - PubMed
    1. Ghanei Z., Jamshidizad A., Joupari M. D., Shamsara M., J. Cell. Physiol. 2020, 235, 7840. - PubMed
    1. Ryan D. P., Hong T. S., Bardeesy N., N. Engl. J. Med. 2014, 371, 1039. - PubMed

LinkOut - more resources