. 2025 Apr 29;16(1):636.
doi: 10.1007/s12672-025-02427-0.

Based on single-cell and transcriptome data, ferroptosis and the immunological landscape in osteosarcoma were discovered

Affiliations

Based on single-cell and transcriptome data, ferroptosis and the immunological landscape in osteosarcoma were discovered

Yingcun Jiang et al. Discov Oncol. .

Abstract

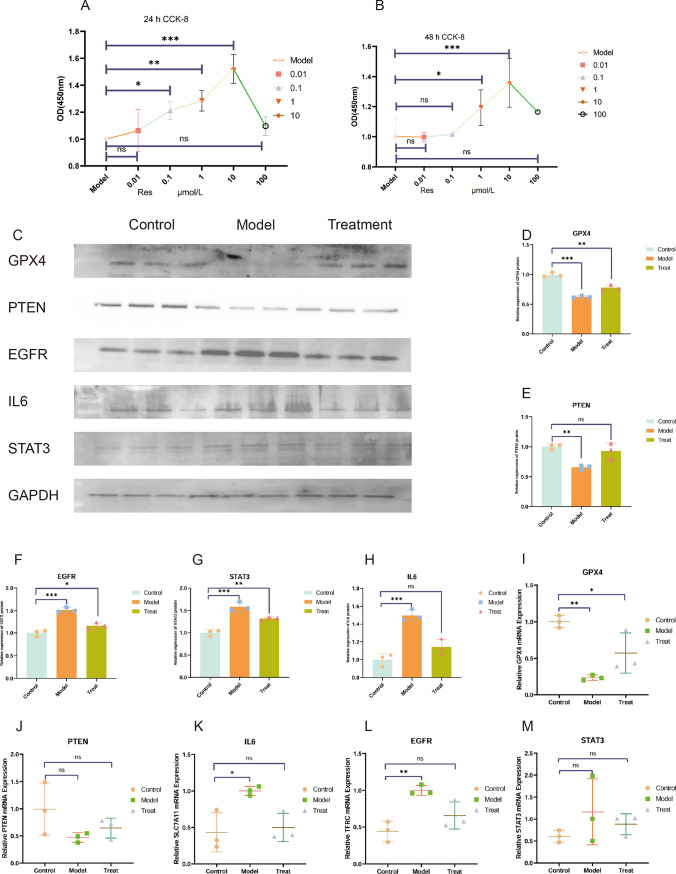
Ferroptosis has been demonstrated to have a significant role in osteosarcoma (OS), a highly aggressive and invasive malignant bone tumor. Nevertheless, the precise molecular mechanism underlying OS remains unknown. Understanding the makeup of the immune microenvironment in OS is crucial for its therapy, as the disease grows in the highly specialized, complex, and dynamic bone microenvironment. Resveratrol (Res) possesses anti-inflammatory, immunomodulatory, chemopreventive, antioxidant, and anticancer properties, it is unknown if it can modify ferroptosis to prevent OS. This time, using single-cell analysis and other bioinformatic studies, we will clarify the targets and composition of the immunological microenvironment of the ferroptosis process in OS, as well as the role of certain transcription factors in it. Ultimately, network pharmacology and vitro experiment have led to the initial identification of the molecular processes governing ferroptosis in OS, which are regulated by Res. The findings suggested the potential use of ALB, EGFR, GPX4, IL6, STAT3, and PTEN as OS prognostic and diagnostic biomarkers. Chondroblastic, myeloid cells, osteoblastic OS, CD4 + T, NK, CD8 + T, B cells, M1 macrophages, Chondro_Proli, etc. made up the majority of the immunological microenvironment of OS. The entire cellular trajectory demonstrates that immune cells infiltrating during the early stages of OS are mostly CD4 + T, NK, CD8 + T, B_cell, and M1 macrophages. This affects the development of myeloid cells and chondroblastic cells, which ultimately leads to the progression of highly malignant chondro cells to OS. Numerous pathways allow transcription factors including BCLAF1, MAF, SP1, TCF12, KLF11, and KMT2D to contribute to the development of tumors. Finally, by interacting with the aforementioned targets, cells, Res is thought to impede the evolution of OS. In conclusion, ferroptosis and alterations in the immunological milieu are significant factors in the development of OS, and Res may one day be employed as a therapeutic drug to treat OS.

Keywords: Ferroptosis; Osteosarcoma; Single-cell analysis; Transcription factors; Tumor microenvironment.


Conflict of interest statement

Declarations. Ethics approval and consent to participate: Not applicable. Consent for publication: Not applicable. Competing interests: The authors declare no competing interests.

Figures

Fig. 1
Fig. 1
Transcriptome analysis A Volcano plot of transcriptome differential genes, B Heat map of transcriptome differential genes, C Intersection of differential genes with Ferroptosis genes, D Protein interactions of intersecting genes, E Top 20 hub genes of intersecting genes, F WGCNA analysis shows when the soft threshold is 5, plotted scale independence for 0.88, G WGCNA analysis shows when the soft threshold is 5, average connectivity 75.10, H Gene clustering pattern tree graph shows total aggregation to 57 modules
Fig. 2
Fig. 2
Differential boxplots of hub genes
Fig. 3
Fig. 3
Biological process analysis of intersecting genes A GO enrichment analysis of intersecting genes, B KEGG enrichment analysis of intersecting genes, C Reactome enrichment analysis of intersecting genes, D Wikipathways enrichment analysis of intersecting genes, E Ferroptosis signaling pathway and related hub genes
Fig. 4
Fig. 4
Transcriptome immune infiltration analysis A Immune infiltration stacking map, B Immune cell expression radar map, C Immune cell expression correlation dot stick map, D Immune cell correlation mountain range map
Fig. 5
Fig. 5
Single cell clustering A single cell tissue distribution before de-batching, B harmony de-batching quality control plot, C single cell tissue distribution after de-batching, D single cell data marker gene labeling heatmap, E copyKAT malignancy prediction heatmap, F cell clustering of single cell samples tissues, G predicted distribution of malignant cells in tissue samples
Fig. 6
Fig. 6
Single-cell trajectory and communication analysis A Scale plot of different cell clusters in tissues, B Scatterplot of screened genes for trajectory analysis of different cell clusters, C Trend distribution of cell trajectory analysis, D Distribution of survival states of different cell clusters, E Temporal developmental trajectories of different cell clusters, F Communication links between different cell clusters, G Communication links between each cell cluster and other cells, H Association network of MIF signaling pathway, I Heat map expression of MIF signaling pathway in cell populations, J Receptor-ligand information of MIF signaling pathway
Fig. 7
Fig. 7
External single-cell validation A Clustering of cells in GSE162454 samples, B Organizational distribution and proportion of cells in GSE162454 samples, C Up-regulation of transcription factors in GSE162454 samples, D Down-regulation of transcription factors in GSE162454 samples, EL Trend of pivotal transcription factors in the pivotal transcription factor of cell populations with significant changes in transcription factors
Fig. 8
Fig. 8
Distribution of hub genes A Distribution and cellular colocalization localization of Ferroptosis hub gene ALB in single cell tissues, B Distribution and cellular colocalization localization of Ferroptosis hub gene GPX4 in single cell tissues, C Distribution and cellular colocalization localization of Ferroptosis hub gene PTEN in single cell tissues, D Distribution and cellular colocalization localization of Ferroptosis hub gene EGFR in single cell tissues localization, E Distribution and cellular colocalization of Ferroptosis hub gene IL6 in single cell tissues, F Distribution and cellular colocalization of Ferroptosis hub gene STAT3 in single cell tissues
Fig. 9
Fig. 9
Mechanism analysis of resveratrol for OS A Resveratrol spectral map, B Intersection of resveratrol with Ferroptosis genes and transcriptome core genes, C KEGG chordal maps of therapeutic genes, D Protein interactions maps of therapeutic genes, E Network maps of resveratrol pivotal targets and signaling pathways for OS treatment
Fig. 10
Fig. 10
Experimental validation results A 24-h CCK 8 line plot of Res intervening OS cells, B 48-h CCK 8 line plot of Res intervening OS cells, C Plot of the GPX4, PTEN, IL6, EGFR, and STAT3 protein bands, D Statistical analysis of different groups of GPX4 proteins, model group VS normal group (***P < 0.001, n = 3) and normal group VS treatment group (**P < 0.01, n = 3), E Statistical analysis of different groups of PTEN proteins, normal group VS model group (**P < 0.01, n = 3), and normal group VS treatment group (NS, n = 3), F Statistical analysis of different groups of proteins of EGFR, model group vs. normal group (***P < 0.001, n = 3),treatment group vs. normal group (*P < 0.05, n = 3), G Statistical analysis of different groups of proteins of STAT3, model group vs. normal group (***P < 0.001, n = 3), treatment group vs. normal group (**P < 0.01, n = 3), and H IL6 different groups protein statistical analysis, model group vs normal group (***P < 0.001, n = 3),treatment group vs normal group (NS, n = 3), I GPX4 different groups RNA statistical analysis, model group vs normal group (**P < 0.01, n = 3),treatment group vs normal group (*P < 0.05, n = 3), J PTEN different group RNA statistical analysis, model group vs normal group (NS, n = 3),treatment group vs normal group (NS, n = 3), K IL6 different group RNA statistical analysis, model group vs normal group (*P < 0.05, n = 3),treatment group vs normal group (NS, n = 3), L EGFR different group RNA statistical analysis, model group vs normal group (**P < 0.01, n = 3),treatment group vs. normal group (NS, n = 3), M STAT3 different groups RNA statistical analysis, model group vs. normal group (NS, n = 3),treatment group vs. normal group (NS, n = 3)

Similar articles

Cited by

References

    1. Dahlin DC. Pathology of osteosarcoma. Clin Orthop Relat Res. 1975;111:23–32. - PubMed
    1. Simpson S, et al. Comparative review of human and canine osteosarcoma: morphology, epidemiology, prognosis, treatment and genetics. Acta Vet Scand. 2017;59(1):71. - PMC - PubMed
    1. Gianferante DM, Mirabello L, Savage SA. Germline and somatic genetics of osteosarcoma—connecting aetiology, biology and therapy. Nat Rev Endocrinol. 2017;13(8):480–91. - PubMed
    1. Jiang X, Stockwell BR, Conrad M. Ferroptosis: mechanisms, biology and role in disease. Nat Rev Mol Cell Biol. 2021;22(4):266–82. - PMC - PubMed
    1. Tong X, et al. Targeting cell death pathways for cancer therapy: recent developments in necroptosis, pyroptosis, ferroptosis, and cuproptosis research. J Hematol Oncol. 2022;15(1):174. - PMC - PubMed

LinkOut - more resources