. 2025 Apr 4;13(4):874.
doi: 10.3390/biomedicines13040874.

The Elevation and Impact of Peripheral Bile Acids in Chronic Lymphocytic Leukemia

Affiliations

The Elevation and Impact of Peripheral Bile Acids in Chronic Lymphocytic Leukemia

Audrey L Smith et al. Biomedicines. .

Abstract

Background: Chronic lymphocytic leukemia (CLL) is the most prevalent adult leukemia in the Western world. Targeted therapies have made CLL manageable for many patients, but the ongoing threat of disease relapse or transformation beckons a deeper understanding of CLL pathogenesis, and thus, its durable eradication. This study identifies bile acids (BAs) as elevated in the peripheral blood of CLL patients and a murine model of CLL, in comparison to healthy controls. Elevated BA concentrations have been associated with intestinal malignancies and immunomodulation; however, their role in CLL is relatively unknown. Methods: Metabolomic analysis was performed on murine and human plasma. Flow cytometry analysis of CLL patient B-cells and healthy donor T-cells were utilized to evaluate the immunomodulatory impact of differentially abundant BAs. Results: Herein, BAs were found to be differentially abundant in CLL. Elevated BAs demonstrated minimal impact on CLL cell proliferation or CLL-associated T-cell function. Conclusions: Future studies are needed to determine the mechanistic influence of BAs on CLL pathogenesis.

Keywords: TCL1 mouse model; bile acids; chronic lymphocytic leukemia (CLL); metabolomics.


Conflict of interest statement

A.L.S, A.R., S.A.S., R.M.R., E.M.D., and E.M. declare no conflict of interest. C.R.D. consults for Abbvie, Genmab, Bristol-Myers Squibb, Beigene, and Curis Inc. C.R.D. has received research funding from Fate Therapeutics, BeiGene, Curis Inc., and Bristol-Myers-Squibb. C.R.D and D.E.-G. and have received research funding from AbbVie.

Figures

Figure 1
Figure 1
Untargeted metabolomics (UPLC–MS/MS; Metabolon Inc.) performed on plasma from Eµ-TCL1 adoptive transfer (AT) mice (n = 4) and C57BL/6 wild-type (WT) mice (n = 6). (A) Ingenuity Pathway Analysis of differential metabolites (Eµ-TCL1 AT vs. WT; 0.5 < log2FC < −0.5). Red = positive z-score; gray = negative z-score. (B) Abundance of bile acids in the plasma of WT and Eµ-TCL1 AT mice. Bolded text indicates key pathways or bile acids of interest. Asterisks denote significant difference from WT, as determined by Welch’s two-sample t-test. * p < 0.05, ** p < 0.01.
Figure 2
Figure 2
(A,B) Untargeted metabolomics (UPLC–MS/MS; NovoGene Co.) performed on plasma from CLL patients (n = 18) and healthy donors (HD; n = 12). (A) Ingenuity Pathway Analysis of differential metabolites (CLL vs. HD; 0.5 < log2FC < −0.5). Red = positive z-score; gray = negative z-score. Bolded text indicates bile acid-related pathways. (B) Abundance of bile acids (BAs) in the plasma of HD and CLL individuals. CLL patients are split into those with a white blood cell count (WBC) of less than the median of samples evaluated: 40,000 cells/µL blood (n = 8; WBC < 40) and those with a WBC greater than 40,000 cells/uL blood (n = 10; WBC > 40). Bolded BAs indicate those evaluated further in Figure 3 and Figure 4. (C) Fold difference in total BAs detected in plasma samples from CLL patients with WBC < 40 (n = 15) and CLL patients with WBC > 40 (n = 17), compared to healthy donors (HD; n = 16). Asterisks denote significant difference from HD, as determined by one-way ANOVA with Dunnett’s correction for multiple comparisons. * p < 0.05, ** p < 0.01.
Figure 3
Figure 3
CLL patient-derived PBMCs (>90% CD19+/CD5+ cells; n = 4 patient samples) treated with 0–200 µM of bile acids for 48 h without (A) or with (B) the addition of 1.7 µM CpG-ODN 2006 (CpG-ODN). CLL cell proliferation was assessed by MTS assay. Results are demonstrated as percent proliferation, normalized to the vehicle control. ACA: apocholic acid, TCA: taurocholic acid, CDCA: chenodeoxycholic acid, TCDCA: taurochenodeoxycholic acid, UDCA: ursodeoxycholic acid, 7KLCA: 7-ketolithocholic acid, HDCA: hyodeoxycholic acid, MDCA: murideoxycholic acid, IDCA: isodeoxycholic acid, DCA: deoxycholic acid, TLCA: taurolithocholic acid, TDCA: taurodeoxycholic acid.
Figure 4
Figure 4
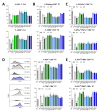
Healthy donor T-cells (TC) cultured alone or co-cultured (CC) with CLL patient-derived B-CLL cells (2:1 B-CLL:T) ratio, stimulated with 10 μg/mL plate-bound anti-CD3, 5 μg/mL soluble anti-CD28, and 1.7 μM CpG-ODN 2006, and treated with the indicated BAs (50 µM), control BET inhibitor (JQ1; 5 µM) or vehicle control (VEH; DMSO) for 48–96 h (n = 6 patient samples). Following treatment, cells were evaluated by flow cytometry for immune molecule expression and function. (A) Percentages of co-cultured CLL cells expressing immune inhibitory molecules (48 h culture). (B) Top: percentage of CFSE-stained CD8+ T-cells that underwent cell division (96 h culture). Bottom: percentage of activated (CD69+) CD8+ T-cells (48 h culture). (C) Following 48 h culture, cells were stimulated with PMA/ionomycin for 6 h with Brefeldin-A added for the final 5 h. Top: the percentage of CD8+ T-cells with membrane-localized CD107a. Bottom: the percentage of polyfunctional CD8+ T-cells co-expressing IFN-γ and TNF-α. (D,E) Percentages of CD8+ T-cells expressing immune inhibitory receptors or transcription factors (48 h culture). (D) Left panels illustrate representative flow cytometry plots for the expression of PD1 (top) and TOX (bottom) in CD8+ T-cells. (E) PD1lo/TIM3 = progenitor-exhausted T-cells; PD1hi/TIM3+ = terminally exhausted T-cells. Data are represented as mean ± SEM. Asterisks denote significant difference from CLL or TC + B-CLL (CC) VEH (one-way ANOVA with Dunnett’s correction for multiple comparisons). * p < 0.05, ** p < 0.01, *** p < 0.001. ACA: apocholic acid, TCA: taurocholic acid, CDCA: chenodeoxycholic acid, TCDCA: taurochenodeoxycholic acid, UDCA: ursodeoxycholic acid, 7KLCA: 7-ketolithocholic acid, HDCA: hyodeoxycholic acid, MDCA: murideoxycholic acid, IDCA: isodeoxycholic acid, DCA: deoxycholic acid, TLCA: taurolithocholic acid, TDCA: taurodeoxycholic acid.

Similar articles

References

    1. Kipps T.J., Stevenson F.K., Wu C.J., Croce C.M., Packham G., Wierda W.G., O’Brien S., Gribben J., Rai K. Chronic lymphocytic leukaemia. Nat. Rev. Dis. Primers. 2017;3:16096. - PMC - PubMed
    1. Hallek M. Chronic Lymphocytic Leukemia: 2025 Update on the Epidemiology, Pathogenesis, Diagnosis, and Therapy. Am. J. Hematol. 2025;100:450–480. - PMC - PubMed
    1. Arruga F., Gyau B.B., Iannello A., Vitale N., Vaisitti T., Deaglio S. Immune Response Dysfunction in Chronic Lymphocytic Leukemia: Dissecting Molecular Mechanisms and Microenvironmental Conditions. Int. J. Mol. Sci. 2020;21:1825. doi: 10.3390/ijms21051825. - DOI - PMC - PubMed
    1. Vom Stein A.F., Hallek M., Nguyen P.H. Role of the tumor microenvironment in CLL pathogenesis. Semin. Hematol. 2024;61:142–154. doi: 10.1053/j.seminhematol.2023.12.004. - DOI - PubMed
    1. di Gregorio M.C., Cautela J., Galantini L. Physiology and Physical Chemistry of Bile Acids. Int. J. Mol. Sci. 2021;22:1780. doi: 10.3390/ijms22041780. - DOI - PMC - PubMed

LinkOut - more resources