. 2025 Apr 9;13(4):909.
doi: 10.3390/biomedicines13040909.

Comprehensive Integrated Analysis Reveals the Spatiotemporal Microevolution of Cancer Cells in Patients with Bone-Metastatic Prostate Cancer

Affiliations

Comprehensive Integrated Analysis Reveals the Spatiotemporal Microevolution of Cancer Cells in Patients with Bone-Metastatic Prostate Cancer

Yinghua Feng et al. Biomedicines. .

Abstract

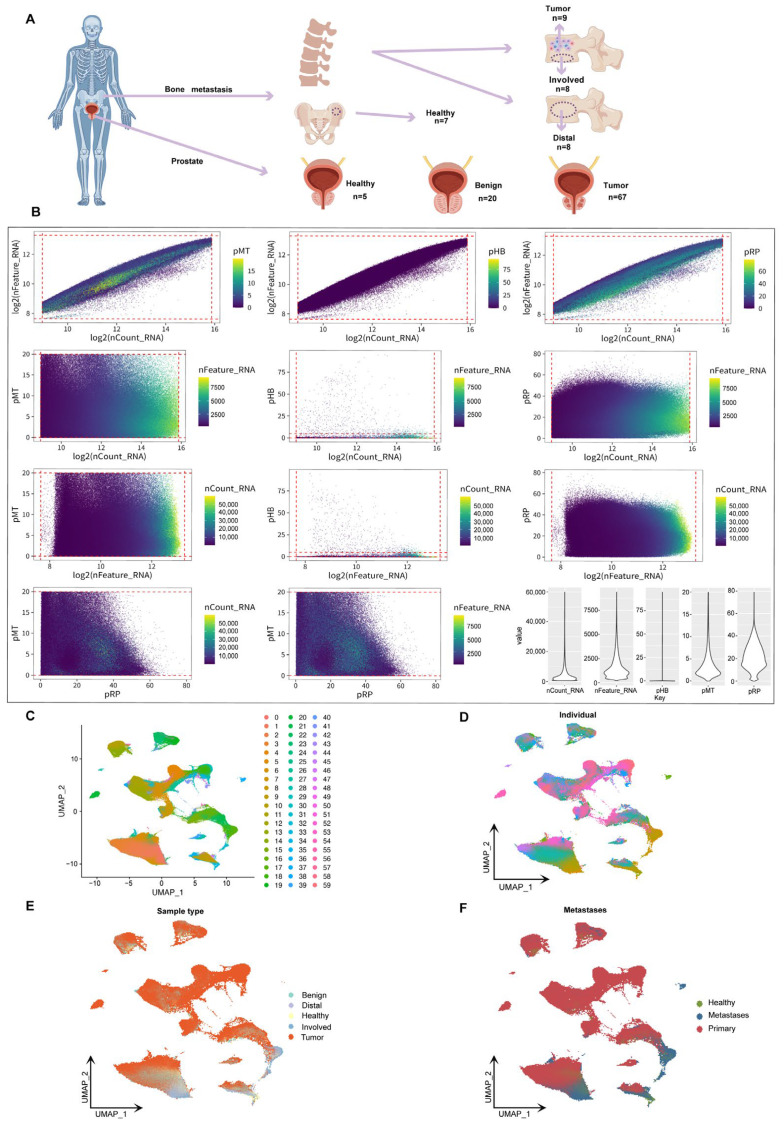
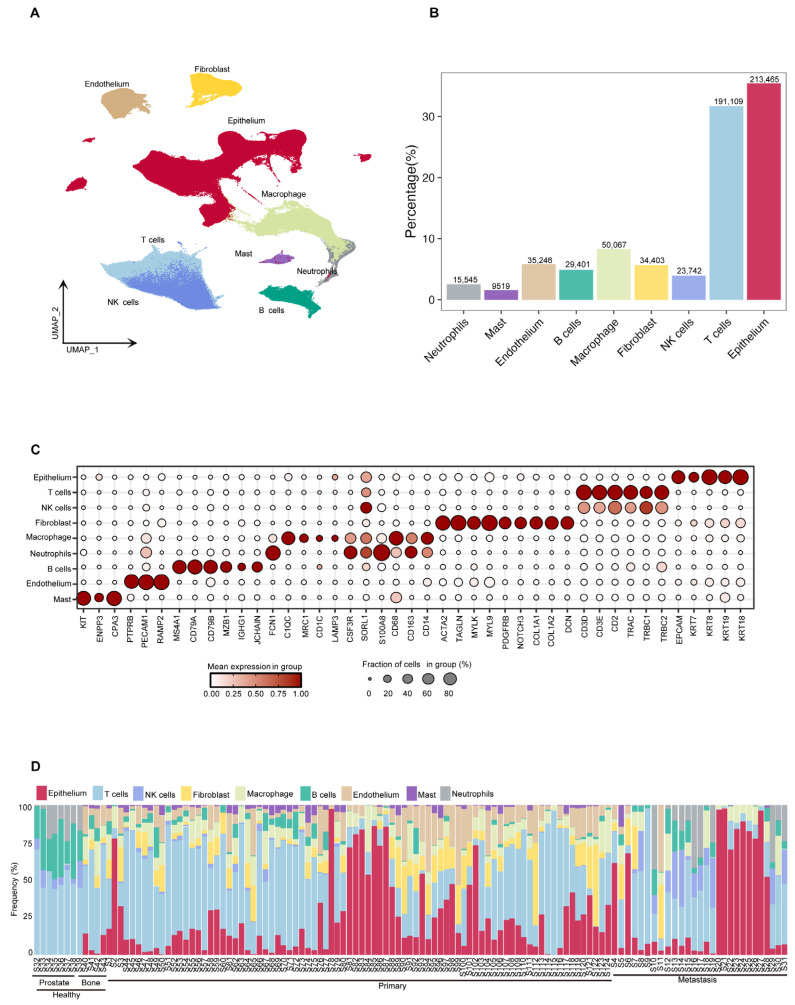
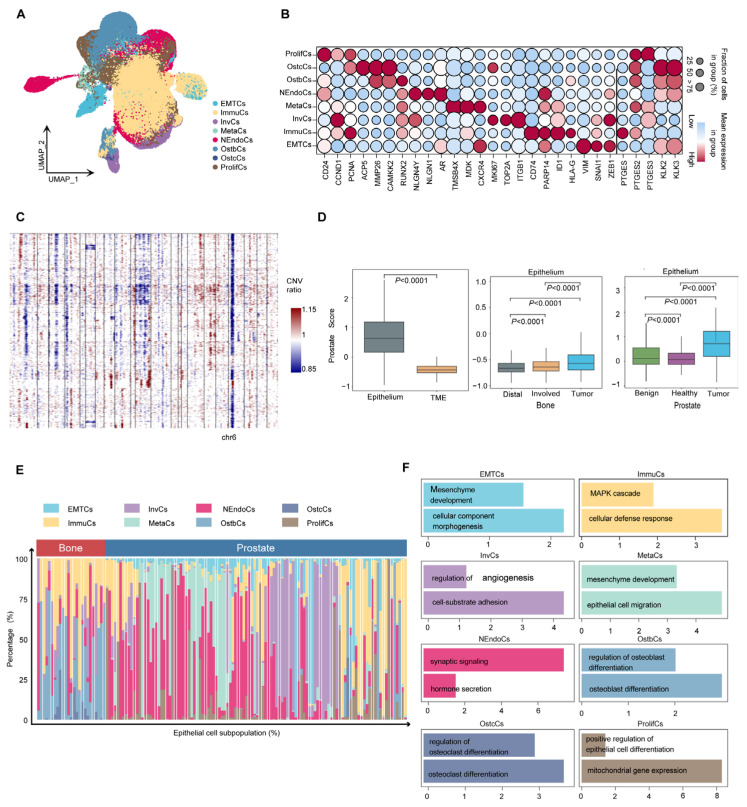
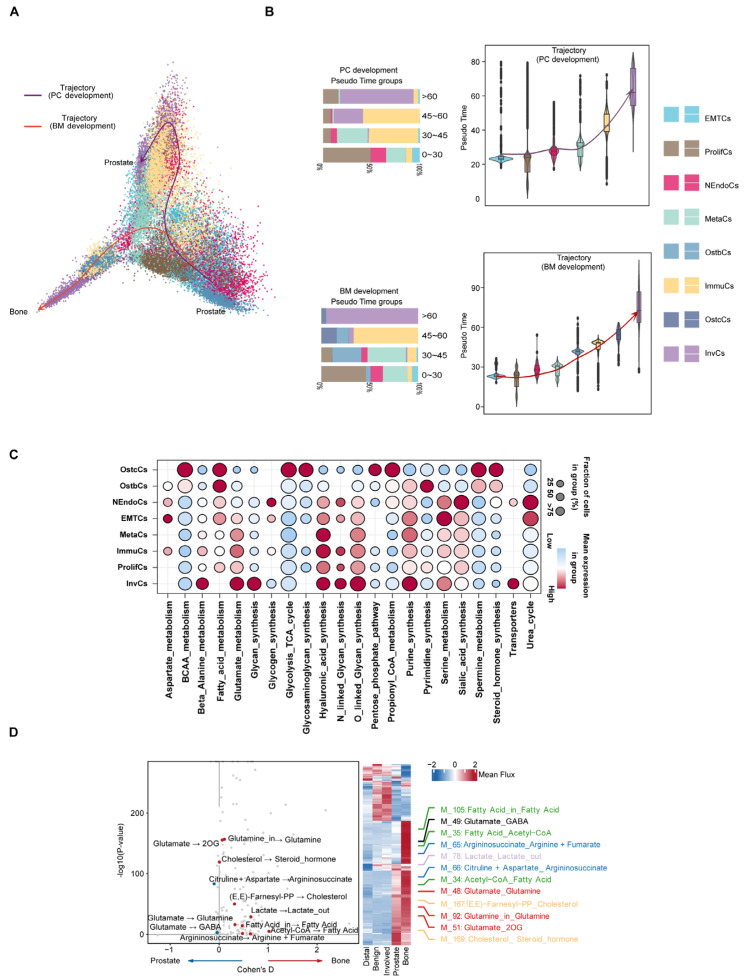
Background/Objectives: Bone metastasis is a frequent and life-threatening event in advanced cancers, affecting up to 70-85% of prostate cancer patients. Understanding the cellular and molecular mechanisms underlying bone metastasis is essential for developing targeted therapies. This study aimed to systematically characterize the heterogeneity and microenvironmental adaptation of prostate cancer bone metastases using single-cell transcriptomics. Methods: We integrated the largest single-cell transcriptome dataset to date, encompassing 124 samples from primary prostate tumors, various bone metastatic sites, and non-malignant tissues (e.g., benign prostatic hyperplasia, normal bone marrow). After quality control, 602,497 high-quality single-cell transcriptomes were analyzed. We employed unsupervised clustering, gene expression profiling, mutation analysis, and metabolic pathway reconstruction to characterize cancer cell subtypes and tumor microenvironmental remodeling. Results: Cancer epithelial cells dominated the tumor microenvironment but exhibited pronounced heterogeneity, posing challenges for conventional clustering methods. By integrating genetic and metabolic features, we revealed key evolutionary trajectories of epithelial cancer cells during metastasis. Notably, we identified a novel epithelial subpopulation, NEndoCs, characterized by unique differentiation patterns and distinct spatial distribution across metastatic niches. We also observed significant metabolic reprogramming and recurrent mutations linked to prostate-to-bone microenvironmental transitions. Conclusions: This study comprehensively elucidates the mutation patterns, metabolic reprogramming, and microenvironment adaptation mechanisms of bone metastasis in prostate cancer, providing key molecular targets and clinical strategies for the precise treatment of bone metastatic prostate cancer.

Keywords: bone metastasis; metabolism and cytokines; prostate cancer; single-cell RNA sequencing; spatiotemporal microevolution.


Conflict of interest statement

The authors declare that they have no known competing financial interests or personal relationships that could have appeared to influence the work reported in this paper.

Figures

Figure 1
Figure 1
UMAP analysis and classification of prostate cancer bone metastases. (A) Schematic showing sample sources, including prostate tissues (healthy, benign, tumor) and bone marrow samples from tumor sites (Involved), distant vertebrae (Distal), and hip-derived healthy controls. (B) Pairwise plots of key quality control metrics: RNA counts (nCount_RNA), gene features (nFeature_RNA), and percentages of mitochondrial (pMT), hemoglobin (pHB), and ribosomal (pRP) genes. Violin plots (right) show distributions across all cells. (C) Shows the clustering of samples in two-dimensional space, with colors representing different clustering groups. (D) The UMAP shows the cell distribution of a single sample (n = 124). Each color represents a different sample to account for inter-individual differences in cell transcriptome profiles. (E) UMAP coloring analysis based on sample type (benign, healthy, tumor, Distal, Involved). (F) Displays the distribution of transition states (healthy, metastatic, primary) in the UMAP space.
Figure 2
Figure 2
Analysis of prostate cancer cell composition, gene expression characteristics and inter tissue differences. (A) UMAP projection of all high-quality cells (n = 602,497), colored by major cell types, including epithelial cells, T cells, NK cells, B cells, myeloid cells (macrophages, monocytes), fibroblasts, and endothelial cells. (B) Bar plot showing the proportion and total number of each cell type across the dataset. (C) Dot plot showing the expression of selected marker genes (e.g., EPCAM, KRT18, CD3D, CD79A, CD14, COL1A1, PECAM1) across the identified cell types. Dot size indicates the fraction of cells expressing the gene, and color intensity reflects the average expression level. (D) Stacked bar plot showing the relative cell type proportions per sample, grouped by individual and tissue type. This reveals inter-sample and inter-tissue variation in cell composition.
Figure 3
Figure 3
Heterogeneity of prostate cancer cells. (A) UMAP embedding of epithelial cells reveals eight transcriptionally distinct subpopulations, including ProlifCs, MetaCs, InvCs, ImmuCs, EMTCs, NEndoCs, OstcCs, and OstbCs states. (B) Dot plot showing the expression of representative marker genes across epithelial subtypes. Dot size indicates the percentage of cells expressing each gene; color intensity reflects average expression. (C) Copy number variation (CNV) heatmap across epithelial subtypes, inferred from averaged expression along the genome. Blue and red indicate relative loss or gain of genomic regions, respectively. (D) Box plots of epithelial versus tumor microenvironment (TME) scores across different tissues. Comparisons include tumor vs. TME, Distal vs. Involved bone marrow, and prostate tissue states (Healthy, Benign, Tumor). (E) Stacked bar plot showing the proportional distribution of epithelial subpopulations in prostate versus bone-derived tissues across all individuals. (F) Functional enrichment analysis of each epithelial subpopulation, highlighting major biological pathways such as epithelial differentiation, osteoclast/osteoblast regulation, immune response, and mesenchymal development.
Figure 4
Figure 4
Evolutionary trajectories and regulatory features of prostate cancer progression and bone metastasis. (A) Pseudo-temporal analysis reveals two major developmental paths: prostate cancer progression (PC trajectory, purple) and bone metastasis adaptation (BM trajectory, red). Cells are colored by epithelial subtypes. Arrows indicate the inferred direction of differentiation across tumor states. (B) Violin plots showing the distribution of epithelial cell subtypes along pseudo time in both PC and BM trajectories. Bar plots on the left summarize the subtype composition in each pseudo time group. (C) Bubble plot showing enrichment of transcription factors (TFs) across epithelial subtypes, highlighting key regulatory programs associated with specific cell states. Dot size represents proportion of cells expressing the TF; color reflects average expression level. (D) Differential metabolic flux analysis between prostate and bone-derived epithelial cells. Left: volcano plot showing significantly altered metabolic reactions. Right: heatmap and line plots illustrate mean flux differences in key pathways (e.g., glutamine metabolism, lipid metabolism, steroid biosynthesis) across sample types.
Figure 5
Figure 5
Mutational landscape, regulatory networks, and gene expression heat maps of prostate cancer and its subtypes. (A) Oncoplot showing somatic mutations across 505 prostate cancer samples. Frequently mutated genes are listed on the left, with mutation types color-coded (e.g., missense, nonsense, splice site). The bar plot on the right shows the mutation frequency of each gene. (B) Distribution of mutation types (e.g., T > C, C > A, T > A) across clinical groups. Lower panel shows mutational signature contributions by sample. (C) Mutation burden (log-transformed) across epithelial cell subtypes, indicating increased mutational accumulation along tumor progression. (D) Inferred developmental lineage tree of prostate cancer epithelial subpopulations. Nodes represent distinct subtypes or intermediate states, and arrows indicate potential transition paths. Percentages denote the confidence or assignment probability of each node. The tree structure suggests hierarchical progression from root-like proliferative or mixed states toward more specialized subtypes such as MetaCs, NEndoCs, or OstbCs.
Figure 6
Figure 6
Mutational landscape and pathway changes in prostate cancer development. (A) Heatmap illustrating mutations in key genes across prostate cancer samples, categorized into functional groups such as transcriptional regulation, prostate-related pathways, signal transduction, extracellular matrix remodeling, circadian rhythm, Y chromosome-associated genes, and metabolism. The mutation types analyzed (e.g., missense, nonsense, splice site, and indels) are color-coded for visualization, and the number of samples harboring mutations in each gene is visualized as bar plots on the right. Subtypes are represented by distinct colors at the bottom of the heatmap. (B) Heatmap of gene expression across different prostate cancer subtypes. Red denotes high expression levels, whereas blue indicates low expression levels. Subtypes are ordered to emphasize differences in gene expression patterns, reflecting tumor heterogeneity.

Similar articles

References

    1. Zi H., Liu M.-Y., Luo L.-S., Huang Q., Luo P.-C., Luan H.-H., Huang J., Wang D.-Q., Wang Y.-B., Zhang Y.-Y., et al. Global burden of benign prostatic hyperplasia, urinary tract infections, urolithiasis, bladder cancer, kidney cancer, and prostate cancer from 1990 to 2021. Mil. Med. Res. 2024;11:64. doi: 10.1186/s40779-024-00569-w. - DOI - PMC - PubMed
    1. Bray F., Laversanne M., Sung H., Ferlay J., Siegel R.L., Soerjomataram I., Jemal A. Global cancer statistics 2022: GLOBOCAN estimates of incidence and mortality worldwide for 36 cancers in 185 countries. CA Cancer J. Clin. 2024;74:229–263. doi: 10.3322/caac.21834. - DOI - PubMed
    1. Schafer E.J., Laversanne M., Sung H., Soerjomataram I., Briganti A., Dahut W., Bray F., Jemal A. Recent Patterns and Trends in Global Prostate Cancer Incidence and Mortality: An Update. Eur. Urol. 2024;87:302–313. doi: 10.1016/j.eururo.2024.11.013. - DOI - PMC - PubMed
    1. Al Hussein Al Awamlh B., Wallis C.J.D., Penson D.F., Huang L.-C., Zhao Z., Conwill R., Talwar R., Morgans A.K., Goodman M., Hamilton A.S., et al. Functional Outcomes After Localized Prostate Cancer Treatment. JAMA. 2024;331:302–317. doi: 10.1001/jama.2023.26491. - DOI - PMC - PubMed
    1. Berish R.B., Ali A.N., Telmer P.G., Ronald J.A., Leong H.S. Translational models of prostate cancer bone metastasis. Nat. Rev. Urol. 2018;15:403–421. doi: 10.1038/s41585-018-0020-2. - DOI - PubMed

LinkOut - more resources