. 2025 Apr 29;135(13):e187862.
doi: 10.1172/JCI187862. eCollection 2025 Jul 1.

OCA-B promotes pathogenic maturation of stem-like CD4+ T cells and autoimmune demyelination

Affiliations

OCA-B promotes pathogenic maturation of stem-like CD4+ T cells and autoimmune demyelination

Erik P Hughes et al. J Clin Invest. .

Abstract

Stem-like T cells selectively contribute to autoimmunity, but the activities that promote their pathogenicity are incompletely understood. Here, we identify the transcription coregulator OCA-B as a driver of the pathogenic maturation of stem-like CD4+ T cells to promote autoimmune demyelination. Using 2 human multiple sclerosis (MS) datasets, we show that POU2AF1, the gene encoding OCA-B, is elevated in CD4+ T cells from patients with MS. We show that T cell-intrinsic OCA-B loss protects mice from experimental autoimmune encephalomyelitis (EAE) while preserving responses to viral CNS infection. In EAE models driven by antigen re-encounter, OCA-B deletion nearly eliminates CNS infiltration, proinflammatory cytokine production, and clinical disease. OCA-B-expressing CD4+ T cells of mice primed with autoantigen express an encephalitogenic gene program and preferentially confer disease. In a relapsing-remitting EAE model, OCA-B loss protects mice specifically at relapse. During remission, OCA-B promotes the expression of Tcf7, Slamf6, and Sell in proliferating CNS T cell populations. At relapse time points, OCA-B loss results in both the accumulation of an immunomodulatory CD4+ T cell population expressing Ccr9 and Bach2, and loss of proinflammatory gene expression from Th17 cells. These results identify OCA-B as a driver of pathogenic CD4+ T cells.

Keywords: Autoimmunity; Immunology; Multiple sclerosis; T cells.


Conflict of interest statement

Conflict of interest: The authors have declared that no conflict of interest exists.

Figures

Figure 1
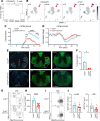
Figure 1. OCA-B loss protects animals from chronic EAE.
(A) CD4+ T cell nuclei from single-nucleus RNA-Seq data of patients with primary-progressive (PPMS), RRMS, or SPMS lesions and from control participants (43) were identified and tested in silico for POU2AF1 expression, which is displayed as counts per million. Significance was ascribed by Welch’s t test. (B) The CD4+ T cell nuclei were reclustered and displayed as UMAP feature plots showing POU2AF1 (left) and IL1R1 (right) expression in control (CTR) and SPMS brain tissue. Red arrow highlights a likely pathogenic CD4+ population expressing high levels of IL1R1. (C) Ocabfl/fl (n = 16) and Ocabfl/fl;CD4-Cre (n = 22) mice were injected with MOG35–55 peptide in CFA and pertussis toxin to induce EAE. Clinical scores were evaluated after EAE induction to determine disease progression. Significance was ascribed by multiple 2-tailed Student’s t tests. (D) Animal weights were recorded to evaluate weight loss as a measurement of disease progression. Significance was ascribed by 2-way ANOVA. (E) Representative DAPI/MBP immunostaining of thoracic spinal cord sections taken from mice 15 days after EAE induction. Areas of demyelination are marked by decreased MBP staining (green) and often coincide with increased cellular infiltration (blue). (F) Quantification of demyelination in Ocabfl/fl (n = 5) and Ocabfl/fl;CD4-Cre mice (n = 6). Significance was ascribed by 2-tailed Student’s t test. (G) Brain and spinal cords were isolated on day 15 of EAE and analyzed by spectral cytometry. Representative flow cytometry plots of CD45+TCRβ+ CNS infiltrating T cells showing frequency of CD4+ and CD8+ T cells. (H) Quantification of the number of CNS infiltrating CD4+ T cells. Ocabfl/fl (n = 9) and Ocabfl/fl;CD4-Cre (n = 13). Significance was ascribed by 2-tailed Student’s t test. (I) Representative plots showing frequency of MOG38-49 tetramer–positive CD4+ T cells. (J) Quantification of the frequency and count of MOG38-49 tetramer-positive CD4+ T cells. Ocabfl/fl (n = 9) and Ocabfl/fl;CD4-Cre (n = 13). Significance was ascribed by 2-tailed Student’s t test. For clinical scores and normalized weights, values represent mean ± SEM. All other values represent mean ± SD. *P ≤ 0.05, **P ≤ 0.01, ***P ≤ 0.001, and ****P ≤ 0.0001.
Figure 2
Figure 2. OCA-B promotes Th1 and Th17 adoptive-transfer EAE through recall response.
(A and B) Ocabfl/fl and Ocabfl/fl;CD4-Cre mice were primed with MOG35–55 peptide in CFA for 10–14 days. Cells from the spleens and lymph nodes of primed mice were isolated and cultured for 4 days in Th1 or Th17 polarizing conditions. Th1- or Th17-polarized cells (n = 3.0 × 10⁶) were injected i.p. into C57BL/6 wild-type recipient mice (Th1: n = 5 Ocabfl/fl; n = 5 Ocabfl/fl;CD4-Cre) (Th17: n = 3 Ocabfl/fl, n = 4 Ocabfl/fl;CD4-Cre). Clinical scores were assessed for 14–15 days. Significance was ascribed by multiple 2-tailed Student’s t tests. (C) At Th17 adoptive-transfer EAE endpoint, brains and spinal cords were analyzed by flow cytometry. Quantification of brain- and spinal cord–infiltrating CD4+ T cells after Th17 adoptive transfer. Significance was ascribed by 2-tailed Student’s t test. (D) Representative flow cytometry plots showing the frequency of IFN-γ– and IL-17–expressing CD4+ T cells within the spines of Th17-recipient mice. (E) Quantification of IL-17 frequency in spinal cord–infiltrating CD4+ T cells. Significance was ascribed by 2-tailed Student’s t test. (F) Quantification of the total count of IL-17+ CD4+ T cells within the spinal cord of recipient mice. Significance was ascribed by 2-tailed Student’s t test. For clinical scores, values represent mean ± SEM. All other values represent mean ± SD. *P ≤ 0.05, **P ≤ 0.01, ***P ≤ 0.001, and ****P ≤ 0.0001.
Figure 3
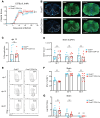
Figure 3. OCA-B is dispensable for T cell response to CNS infection with a neurotropic virus.
(A) Ocabfl/fl (n = 19) and Ocabfl/fl;CD4-Cre (n = 17) mice were injected intracranially with 1500 PFU JHMV. Clinical scores were recorded for 21 dpi. Significance was ascribed by Multiple 2-tailed student’s t tests. (B) Representative DAPI/MBP immunofluorescence staining of spinal cord sections at 12 dpi. Demyelinated areas are marked by decreased MBP staining (green) and often coincide with increased cellular infiltration (blue). (C) Quantification of percent demyelination in spinal cord sections (n = 7 per group). Significance was ascribed by 2-tailed Student’s t test. Half-brains were taken at 7, 12, and 21 dpi for flow cytometric and viral titer analysis. (D) Quantification of CD4+ T cell counts within the half-brains at 7, 12, and 21 dpi. Ocabfl/fl (n = 7–9/time point) and Ocabfl/fl;CD4-Cre (n = 6–7/time point). Significance was ascribed by 2-tailed Student’s t test. (E) Representative plots showing the frequency of IFN-γ–expressing CD4+ T cells at 7, 12, and 21 dpi. (F) Quantification of frequency of IFN-γ–expressing CD4+ T cells. Ocabfl/fl (n = 7–9/time point) and Ocabfl/fl;CD4-Cre (n = 6–7/time point). Significance was ascribed by 2-tailed Student’s t test. (G) Viral titers of half-brains at dpi 7, 12, and 21 (not detected). Ocabfl/fl (n = 7–9/time point) and Ocabfl/fl;CD4-Cre (n = 6–7/time point). Significance was ascribed by 2-tailed Student’s t test. These data represent the combined results of 2 independent experiments. For clinical scores, values represent mean ± SEM. All other values represent mean ± SD. ns = P > 0.05.
Figure 4
Figure 4. OCA-B expression marks encephalitogenic stem-like CD4+ T cells.
(A) OCA-B–mCherry mice were injected with MOG35–55 peptide in CFA and pertussis toxin to induce EAE. Cervical lymph nodes (CLNs), brains, and spines were isolated at peak disease (day 15) and analyzed by flow cytometry for mCherry, CD44, and CD62L expression. (B) CD44+- and CD62L+-expressing CD4+ T cells were quantified based on mCherry expression. Mean values are shown from 5 biological replicates. Significance was ascribed by 2-tailed Student’s t test. (C) OCA-B–mCherry mice were injected with MOG35–55 peptide in CFA, and after 14 days, CD4+ T cells within CLNs and spleens were profiled by flow cytometry for mCherry, CD44, and CD62L expression. (D) Quantification of CD44 and CD62L expression of OCA-B– negative and –positive CD4+ T cells from MOG-primed OCA-B–mCherry mice. n = 4–6 biological replicates from 2 combined replicate experiments are shown. Significance was ascribed by 2-tailed Student’s t test. (E) Heatmap showing relative expression of the top 40 differentially expressed genes from OCA-B–positive and –negative CD4+ T cells from bulk RNA-Seq of OCA-B–positive and –negative CD4+ T cells from MOG35–55 primed OCA-B-mCherry reporter mice. (F) Volcano plot of differentially expressed genes between OCA-B–positive and –negative T cells (P < 0.05 and log2-fold change >1 data points are colored). (G) Gene Ontology terms associated with OCA-B–positive and –negative groups. (H) EAE clinical scores of C57BL/6 wild-type mice after passive transfer of OCA-B–positive or –negative Th1 polarized CD4+ T cells. Significance was ascribed by multiple 2-tailed Student’s t tests. Clinical score values represent mean ± SEM. All other values represent mean ± SD. ns = P > 0.05, *P ≤ 0.05, **P ≤ 0.01, ***P ≤ 0.001, and ****P ≤ 0.0001. KEGG, Kyoto Encyclopedia of Genes and Genomes.
Figure 5
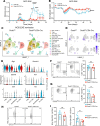
Figure 5. OCA-B promotes relapsing-remitting EAE through stem-like CD4+ T cells.
(A) NOD.Ocabfl/fl (n = 19) and NOD.Ocabfl/fl;CD4-Cre (n = 15) mice were injected with MOG35–55 peptide in CFA and pertussis toxin to induce EAE. Clinical scores of animals representing relapsing-remitting disease progression are shown as a function of time. Significance was ascribed by multiple 2-tailed Student’s t tests. (B) Animal weights were recorded to determine weight loss throughout initial disease and relapse. Significance was ascribed by 2-way ANOVA. (C) scRNA-Seq was performed on pooled CD3ε+ cells isolated from the brain and spine of NOD.Ocabfl/fl (n = 3) and NOD.Ocabfl/fl;CD4-Cre (n = 4) 24 days after EAE induction (remission time point). Cell populations were plotted in a UMAP using the Seurat R package, and percentages are shown for each cluster. Clusters were identified through differential gene expression analysis. (D) Feature plots comparing the expression of Foxp3 and Mki67 among clusters. (E) Violin plots showing the expression of Btg1, Samhd1, Slamf6, Tcf7, Sell, and Tox within the Treg, Th17-like, proliferating, and Th1-like clusters. (F) CNS cells isolated at remission time point (day 24) were analyzed by spectral cytometry. Representative flow cytometry plots and quantification showing the frequency of CD4+ T cells between control and experimental groups. Significance was ascribed by 2-tailed Student’s t test. (G) Representative flow cytometry plots and quantification showing the frequency of CXCR6 expressing CD4+ T cells. Significance was ascribed by 2-tailed Student’s t test. (H) Representative flow cytometry plots showing the frequency of CD4+ T cells expressing IFN-γ and GM-CSF. (I) Quantification of CD4+ T cells expressing IFN-γ and GM-CSF. Significance was ascribed by 2-tailed Student’s t test. For clinical scores, data represent mean ± SEM. All other data represent mean ± SD. ns = P > 0.05, *P ≤ 0.05.
Figure 6
Figure 6. OCA-B promotes disease relapse through control of pathogenic stem-like Th17 differentiation.
(A) scRNA and TCR sequencing were performed on pooled CD3ε+ cells isolated from the brain and spine of NOD.Ocabfl/fl (n = 5) and NOD.Ocabfl/fl;CD4-Cre (n = 6) mice 33 days after EAE induction (relapse time point). Cell populations were plotted in a UMAP using the Seurat R package and percentages are shown for each cluster. Clusters were identified through differential gene expression analysis. (B) UMAP TCR clonotype expansion between Ocabfl/fl and Ocabfl/fl;CD4-Cre among clusters. (C) Violin plots showing expression of Ccr9, Bach2, Ccr7, Tcf7, Cd44, Cxcr6, Il1r1, and Lgals3 in the Ccr9 stem-like CD4, stem-like CD4-2, and Th17-like clusters. (D) Feature plots comparing the expression of Ccr9, Tcf7, and Bach2 among clusters. (E) UMAPs showing RNA velocity of spliced and unspliced transcripts by experimental condition. (F) Violin plots showing expression of Pdcd1, Tigit, and Il1r1 in the Th17-like cluster between control and experimental groups.

Update of

References

    1. Walton C, et al. Rising prevalence of multiple sclerosis worldwide: Insights from the Atlas of MS, third edition. Mult Scler. 2020;26(14):1816–1821. doi: 10.1177/1352458520970841. - DOI - PMC - PubMed
    1. Wtccc CC, et al. Genetic risk and a primary role for cell-mediated immune mechanisms in multiple sclerosis. Nature. 2011;476(7359):214–219. doi: 10.1038/nature10251. - DOI - PMC - PubMed
    1. IMSGC A high-density screen for linkage in multiple sclerosis. Am J Hum Genet. 2005;77(3):454–467. doi: 10.1086/444547. - DOI - PMC - PubMed
    1. Adorini L, et al. Manipulation of the Th1/Th2 cell balance: an approach to treat human autoimmune diseases? Autoimmunity. 1996;23(1):53–68. doi: 10.3109/08916939608995329. - DOI - PubMed
    1. Langrish CL, et al. IL-23 drives a pathogenic T cell population that induces autoimmune inflammation. J Exp Med. 2005;201(2):233–240. doi: 10.1084/jem.20041257. - DOI - PMC - PubMed

MeSH terms