. 2025 Apr 29;135(13):e188807.
doi: 10.1172/JCI188807. eCollection 2025 Jul 1.

A gain-of-function mutation in ATP6V0A4 drives primary distal renal tubular alkalosis with enhanced V-ATPase activity

Affiliations

A gain-of-function mutation in ATP6V0A4 drives primary distal renal tubular alkalosis with enhanced V-ATPase activity

Si-Qi Peng et al. J Clin Invest. .

Abstract

The ATP6V0A4 gene encodes the a4 subunit of vacuolar H+-ATPase (V-ATPase), which mediates hydrogen ion transport across the membrane. Previous studies have suggested that mutations in ATP6V0A4 consistently result in a loss of function, impairing the hydrogen ion transport efficacy of V-ATPase and leading to distal renal tubular acidosis and sensorineural hearing loss. Here, we identified a 32-year-old male patient and his father, both of whom harbored a heterozygous ATP6V0A4 p.V512L mutation and exhibited hypochloremic metabolic alkalosis, acidic urine, and hypokalemia. Through a series of protein structural analyses and functional experiments, the V512L mutation was confirmed as a gain-of-function mutation in the ATP6V0A4 gene. V512-a4 increased a4 subunit expression abundance by enhancing V512L-a4 stability and reducing its degradation, which in turn potentiated the capacity of V-ATPase to acidify the tubular lumen, leading to acidic urine and metabolic alkalosis. Through mutant V512L-a4 subunit structure-based virtual and experimental screening, we identified F351 (C25H26FN3O2S), a small-molecule inhibitor specifically targeting the V512L-a4 mutant. In conclusion, we identified a gain-of-function mutation in the ATP6V0A4 gene, broadening its phenotypic and mutational spectrum, and we provide valuable insights into potential therapeutic approaches for diseases associated with ATP6V0A4 mutations.

Keywords: Genetic diseases; Genetic variation; Genetics; Nephrology.


Figures
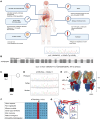
Figure 1
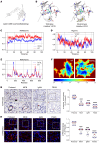
Figure 1. A patient with renal dysfunction, hypochloremic metabolic alkalosis, acidic urine, and hypokalemia, harboring the ATP6V0A4 p.V512L mutation.
(A) The clinicopathological characteristics of the patient. (B) Whole-exome sequencing identified a heterozygous mutation in the ATP6V0A4 gene on chromosome 7 in the patient: c.1534G>T (p.Val512Leu). (C and D) Sanger sequencing of ATP6V0A4, amplified by PCR from leukocyte DNA of the patient and his parents, indicated that the father was a heterozygous carrier of the identified variant. (E) Cryo-EM density of human V-ATPase (PDB:7UNF) with subunits color-coded. Subunit a4 is labeled with red, and the N-terminal domain of the V-ATPase a4 subunit (a4-NT) is situated in the cytoplasm, interacting with the V1 domain to stabilize the enzyme structure; the C-terminal domain (a4-CT) forms a transmembrane proton channel. V512L residue is located at the C-terminus of the a4 subunit. (F) The valine residue altered by the p.V512L mutation is highly conserved across species. (G) Structure of WT-a4 and V512L-a4 as predicted by AlphaFold. SNHL, sensorineural hearing loss; ARR, aldosterone/renin ratio; IFTA, interstitial fibrosis and tubular atrophy; V512L, Val512Leu; Mut, mutant.
Figure 2
Figure 2. Molecular dynamics simulations and validation of patient kidney samples reveal V512L variant increases a4 protein stability and expression abundance.
(A) The prediction outcome of V512L-a4 stability was ΔΔG:0.268 kcal/mol (stabilizing). (B) Prediction of interatomic interactions of p.V512L. Residues 512 in the WT-a4 and V512L-a4 proteins are colored in light green and are shown as sticks. The respective chemical interactions are labeled as dotted lines and colored as follows: hydrogen bonds—(red), weak hydrogen bonds—(orange), hydrophobic contacts—(green), amide-amide contacts—(blue), and ionic interactions—(gold). Amino acid residues are also colored according to type, namely: nitrogen (blue), oxygen (red), and sulfur (yellow). In comparison with WT sites, increased interactions were observed to be added in mutant sites. (C) The WT-a4 has an average RMSD of 1.03 nm, and the V512L-a4 is 0.76 nm. (D) The WT-a4 has an average Rg of 4.500 nm, and the V512L-a4 is 4.455 nm. (E) For the residues between 500 and 530 near the V512L, the WT-a4 has an average RMSF of 0.473 nm, and the V512L-a4 is 0.456 nm. (F) Free energy landscapes for WT-a4 and V512L-a4. The free energy landscape uses a color gradient from blue (indicating high stability, folded states) to red (indicating low stability, unfolded states). IHC (G) and immunofluorescence (H) validated patient renal tubular tissues with increased ATP6V0A4 expression abundance compared with MCN, IgAN, and FSGS. Each group was always compared with the proband, which was considered as the reference group. Scale bar: 40 μm in IHC and immunofluorescence. Violin plots indicate median (red) and upper and lower quartile (blue). ***P < 0.0005, ****P < 0.0001 by 2-tailed unpaired t test. V512L, Val512Leu; RMSD, root mean square deviation; Rg, radius of gyration; RMSF, root mean square fluctuations; MCN, minimal change nephropathy; IgAN, IgA nephropathy; FSGS, focal segmental glomerulosclerosis.
Figure 3
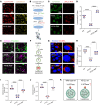
Figure 3. ATP6V0A4 p.V512L mutation enhances stability of the a4 subunit and elevates V-ATPase activity.
(A) The WT and V512L-transduced M1s were constructed using CRISPR/Cas9 genome editing. (B and C) Western blot and (D) RT-qPCR analysis of ATP6V0A4 expression abundance and mRNA levels in HEK293T cells and M1 cells expressing WT-a4 or V512L-a4. β-Actin antibody was used as a protein loading control. n = 6 per group (C); n = 8 per group (D). (E and F) Immunostaining results of ATP6V0A4 expression levels of WT and V512L-transduced M1s. Scale bar: 15 μm. Violin plots indicate median (red) and upper and lower quartile (blue). ****P < 0.0001 by 2-tailed unpaired t test. (G and H) CHX chasing experiment showing ATP6V0A4 stability. WT and V512L-transduced M1s were incubated with medium containing CHX (100 μg/mL). Cells were lysed at 0, 2, 4, 8, 12, and 24 hours after CHX treatment and subjected to Western blot. n = 3. (I) V-ATPase activity and (J) H+-K+-ATPase activity in M1 cells expressing WT-a4 or V512L-a4. n = 3. Data are given as mean ± SEM. M1, mouse collecting duct cells; a4, ATP6V0A4; CHX, cycloheximide.
Figure 4
Figure 4. ATP6V0A4 p.V512L mutation results in excessive lysosomal acidification and impaired lysosomal hydrolase activity.
(AJ) BaF was applied to mildly (50 nm) block the V-ATPase to alkalize the lysosomes and endosomes of V512L-transduced M1s. (A) Lysosomal acidity assessed by LysoTracker (red) and LysoSensor (yellow) staining in WT and V512L-transduced M1s. BaF was applied to mildly (50 nm) block the V-ATPase to alkalize the lysosomes of V512L-transduced M1s. Scale bar: 30 μm. (B and C) Lysosomal pH in WT and V512L-transduced M1s determined using LysoPrime Green (green) and pHLys Red (red). Scale bar: 30 μm. (D) V512L mutation dropped the lysosomal pH from 5 to 2.5; BaF treatment significantly increased lysosomal pH to 6 in V512L-transduced M1s. n = 6 independent biology replicates. (E) Endosomal pH in WT and V512L-transduced M1s determined using ECGreen (purple). Cell membranes, the cell membranes were stained with PlasMem (green). Scale bar: 20 μm. (F) Lysosomal proteolytic activity was measured by DQ-BSA given that proteolysis of DQ-BSA releases protein fragments that are fluorescent. (G) Double immunostaining of DQ-BSA (red) and DAPI (blue) in WT and V512L-transduced M1s. Scale bar: 10 μm. (H) DQ-BSA staining was quantified by dividing total fluorescence intensity by the number of cells in each frame. n = 6. (I) Cathepsin D activity and (J) cathepsin B activity in WT and V512L-transduced M1s. n = 6. (K) V512L-a4 variant elevated the ability of the V-ATPase to acidify lysosomes, resulting in lysosomal hyperacidification and indirectly impairing lysosomal enzyme activity. Data are shown as mean ± SEM. Violin plots indicate median (red) and upper and lower quartile (blue). ****P < 0.0001 by 2-tailed unpaired t test. BaF, bafilomycin A1.
Figure 5
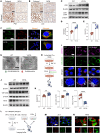
Figure 5. ATP6V0A4 p.V512L mutation blocks autophagic flux and promotes apoptosis.
(A and B) IHC verified the patient had increased renal tubular p62 and LC3 protein expression abundance compared with minimal change nephropathy. Scale bar: 40 μm. (CE) Western blot of P62 and LC3 expression levels in M1 cells stably expressing WT-a4 and V512L-a4. β-Actin antibody was used as a protein loading control. n = 6. (F) V512L mutation attenuated the immunofluorescence colocalization of LC3 and LAMP2 proteins in M1 cells. Scale bar: 20 μm. (G) Compared with WT, transmission electron microscopy showed an increased number of autophagosomes in V512L-transduced M1s. Scale bar: 5 μm. (H and I) DAPRed and DALGreen fluorescent probes, used to monitor the formation of autophagosomes (purple) and autolysosomes (green), showed an accumulation of autophagosomes in V512L-transduced M1s. Bafilomycin A1 was applied to mildly (50 nm) block the V-ATPase to alkalize lysosomes of V512L-transduced M1s. Scale bar: 15 μm. (J and K) Western blot of bax, Cle-cas3, and bcl-2 expression levels in M1 cells stably expressing WT-a4 or V512L-a4, β-Actin antibody was used as a protein loading control. n = 6. (L and M) Mitochondrial membrane potential loss of V512L-transduced M1s was observed as a decrease in JC-1 red fluorescence and an increase in JC-1 green fluorescence. Nuclear, DAPI (blue). Scale bar: 40 μm. (N) Accumulation of ROS (green) was increased in V512L-transduced M1s. Cell membrane, PlasMem (red). Scale bar: 10 μm. Data are shown as mean ± SEM. **P < 0.005, ***P < 0.0005, ****P < 0.0001 by 2-tailed unpaired t test. Cle-cas3, cleaved caspase-3.
Figure 6
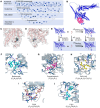
Figure 6. Protein structure–based virtual screening of targeted V512L-a4 inhibitors.
(A) Structure-based virtual screening approach was performed in this study, and the workflow is shown. (B) The docking pockets of the V512L-a4 mutant subunit. The front (C) and rear (D) docking pose of mutant protein and 2 million ligand compounds. (E) MM-GBSA was used to predict the free energy of binding between the V512L-a4 mutant and the set of ligand compounds. (FJ) Five V512L-a4 mutant inhibitor compounds were selected: relamorelin, forsythiaside A, PAR-1AC, F359-0497 (F359), and F351-0364 (F351). The blue solid line represents hydrogen bonds, the gray dashed line represents hydrophobic interactions, and the green dashed line represents π-π interaction.
Figure 7
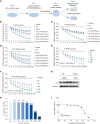
Figure 7. F351 inhibits V-ATPase activity by targeting the V512L-a4 mutant in vitro.
(A) WT and V512L-transduced M1s were treated with indicated concentrations of selected small molecule compounds and were collected at each indicated time point for analysis. F351 was obtained as a white amorphous powder with molecular formula C25H26FN3O2S and a molecular weight of 451.6 g/mol. (B) F351 inhibited V-ATPase activity of V512L-a4 mutant in a concentration-dependent manner. n =3. (C) F351 had no stable inhibitory effect on the V-ATPase activity of WT. n = 3. (D) F351 increased H+-K+-ATPase activity of V512L-a4 mutant in a concentration-dependent manner. n = 3. At a drug concentration of 20 μmol/L, V-ATPase activity (B) and H+-K+-ATPase activity (D) of V512L-transduced M1s were restored to a level equivalent to that of WT. (E and F) Based on the optimal concentration 20 μmol/L, we found that the ideal time point for F351 interventions was 24 hours. n = 3. (G) V512L-transduced M1s were treated with F351 at an optimal concentration of 20 μmol/L for 24 hours, resulting in significant downregulation of V512L-a4 abundance. DMSO was added as solvent control. (H and I) CCK8 screening revealed that 50% cell death of V512L-transduced M1s occurred only at F351 concentrations exceeding 140.9 μmol/L, indicating low cytotoxicity. n = 6. Each group was always compared with the first group, which was considered as the reference group. Data are shown as mean ± SEM. **P < 0.005, ****P < 0.0001 by 2-tailed unpaired t test. F351, F351-0364.
Figure 8
Figure 8. F351 elevates lysosomal pH, promotes autophagosome-lysosome fusion, and mitigates apoptosis by targeting the V512L-a4 mutant in vitro.
F351 elevated lysosomal pH (A) and lysosomal degradation activity (B) of the V512L-a4 mutant in a concentration-dependent manner. At a drug concentration of 20 μmol/L, lysosomal degradation activity was restored to a level equivalent to that of WT. All data are shown as mean ± SEM, n = 6. (C) F351 markedly reversed the expression of autophagy (P62, LC3) and apoptosis-related (bax, bcl-2, cleaved caspase-3) proteins in the V512L-a4 mutant. DMSO was added as solvent control. (D) F351 promoted the fusion of autophagosomes and lysosomes in the V512L-a4 mutant. Double membrane autophagosomes (green), single membrane autolysosomes (red). Scale bars: 5 μm.

References

    1. Wang L, et al. Structures of a complete human V-ATPase reveal mechanisms of its assembly. Mol Cell. 2020;80(3):501–511. doi: 10.1016/j.molcel.2020.09.029. - DOI - PMC - PubMed
    1. Eaton AF, et al. The H+-ATPase (V-ATPase): from proton pump to signaling complex in health and disease. Am J Physiol Cell Physiol. 2021;320(3):C392–C414. doi: 10.1152/ajpcell.00442.2020. - DOI - PMC - PubMed
    1. Wagner CA, et al. Renal vacuolar H+-ATPase. Physiol Rev. 2004;84(4):1263–1314. doi: 10.1152/physrev.00045.2003. - DOI - PubMed
    1. Wagner CA, et al. The pathophysiology of distal renal tubular acidosis. Nat Rev Nephrol. 2023;19(6):384–400. doi: 10.1038/s41581-023-00699-9. - DOI - PubMed
    1. Karet FE, et al. Localization of a gene for autosomal recessive distal renal tubular acidosis with normal hearing (rdRTA2) to 7q33-34. Am J Hum Genet. 1999;65(6):1656–1665. doi: 10.1086/302679. - DOI - PMC - PubMed

MeSH terms

Substances