. 2025 Apr 11;13(4):942.
doi: 10.3390/biomedicines13040942.

Integration of Transcriptomic and Single-Cell Data to Uncover Senescence- and Ferroptosis-Associated Biomarkers in Sepsis

Affiliations

Integration of Transcriptomic and Single-Cell Data to Uncover Senescence- and Ferroptosis-Associated Biomarkers in Sepsis

Xiangqian Zhang et al. Biomedicines. .

Abstract

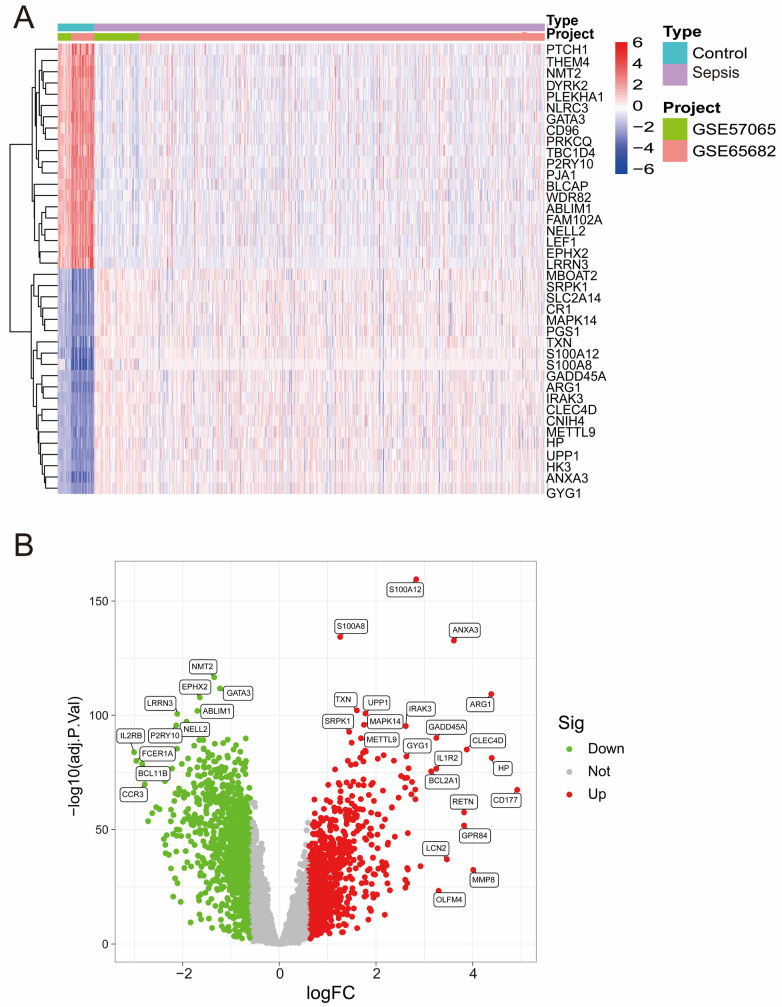
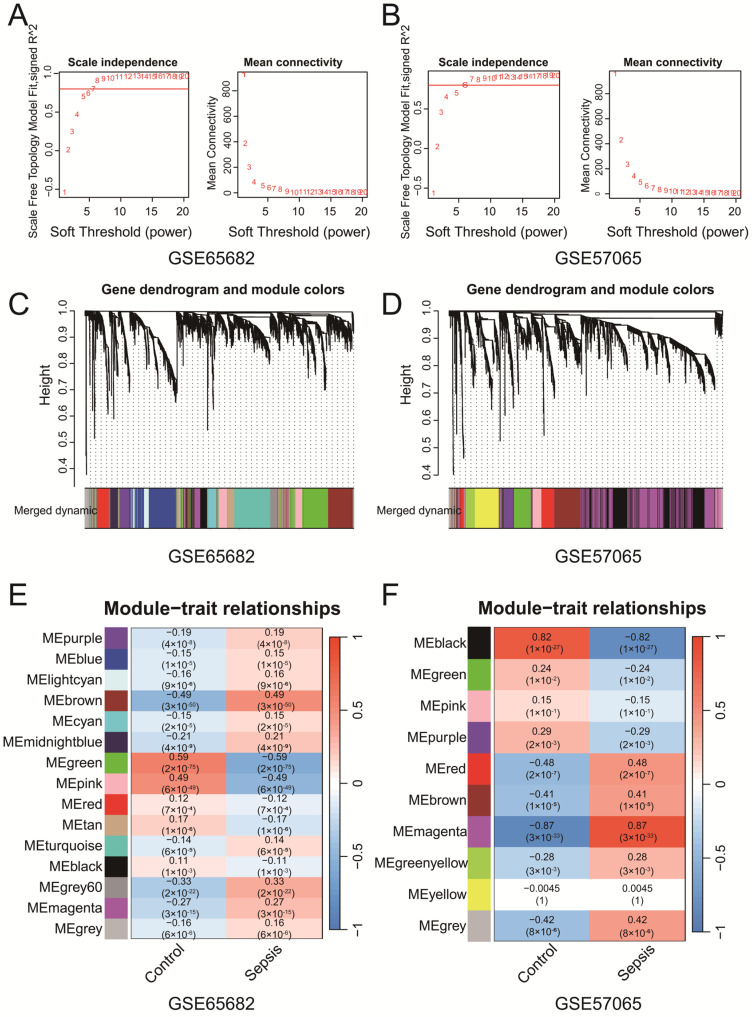
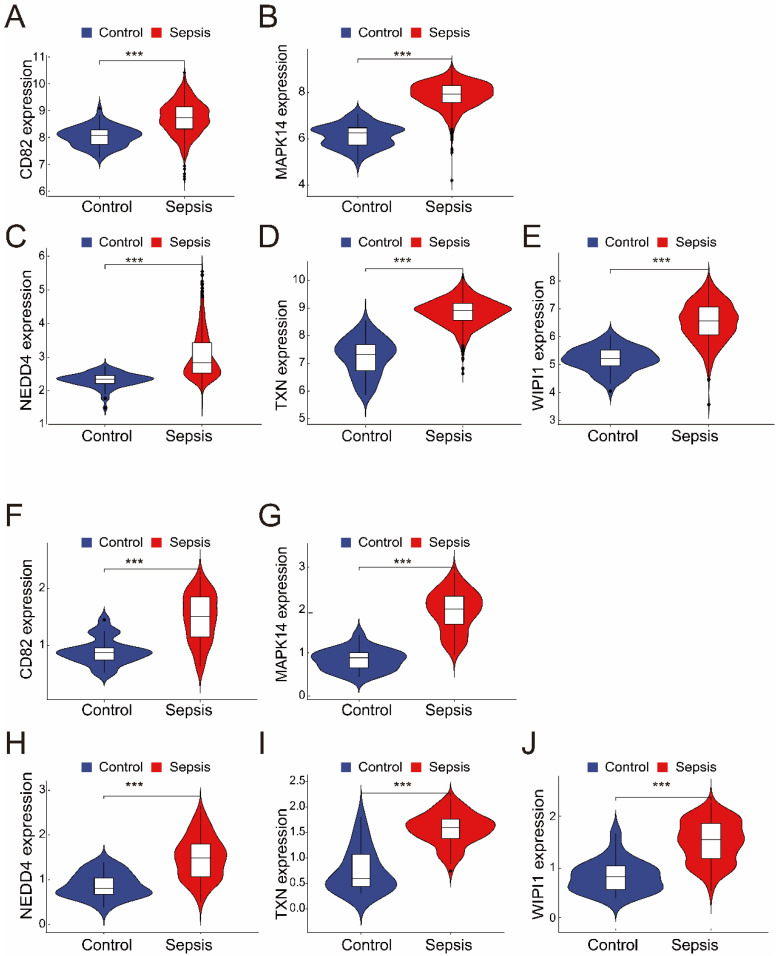
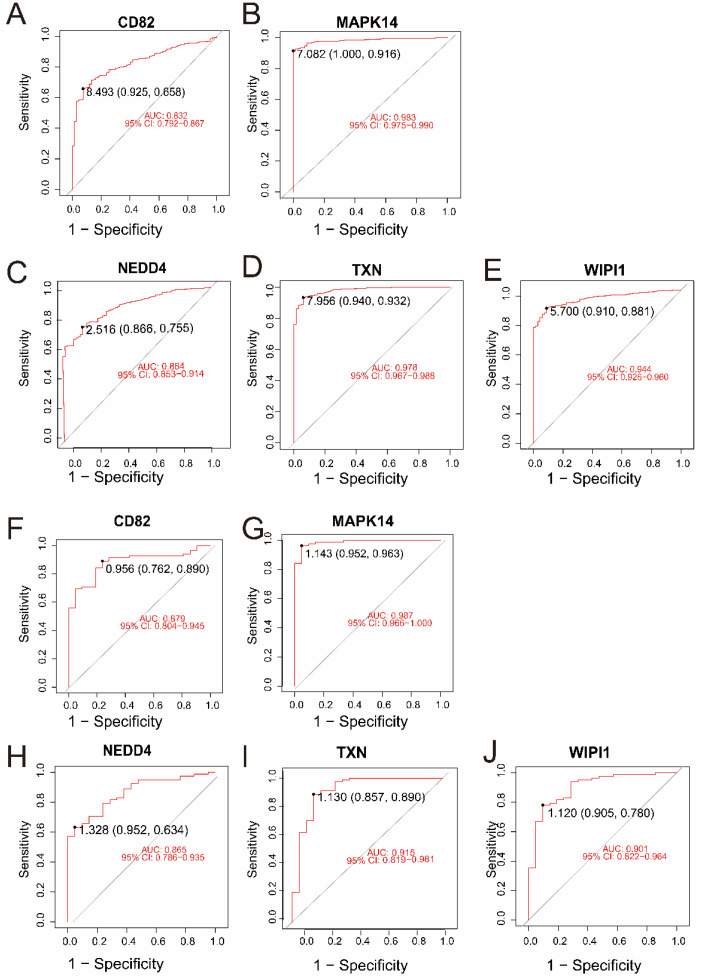
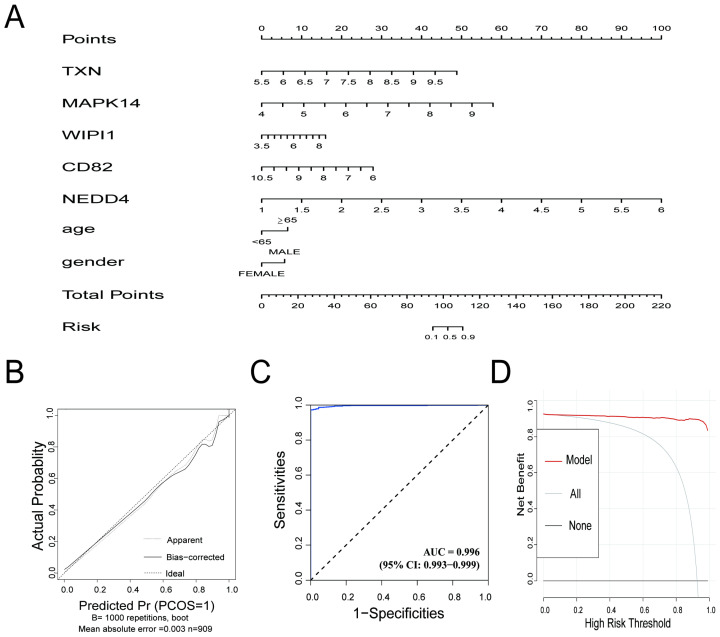
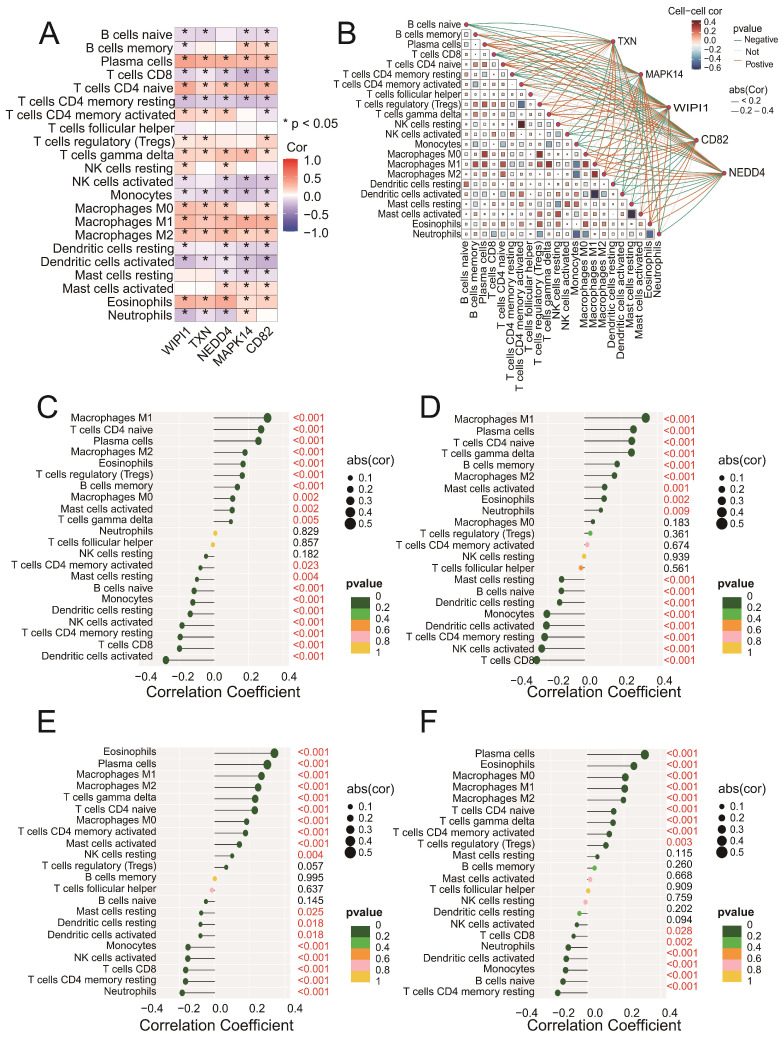
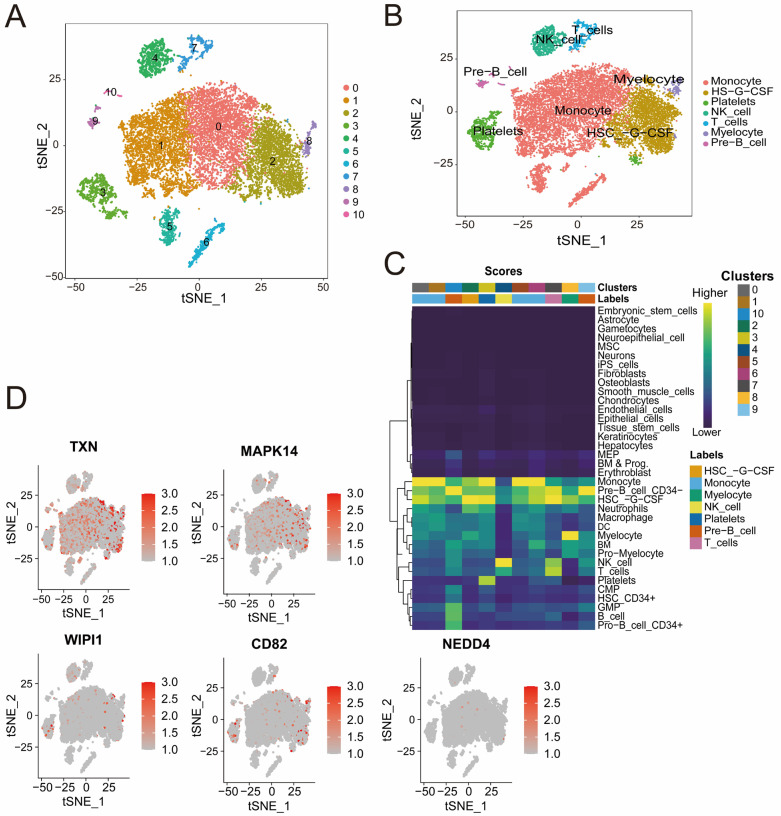
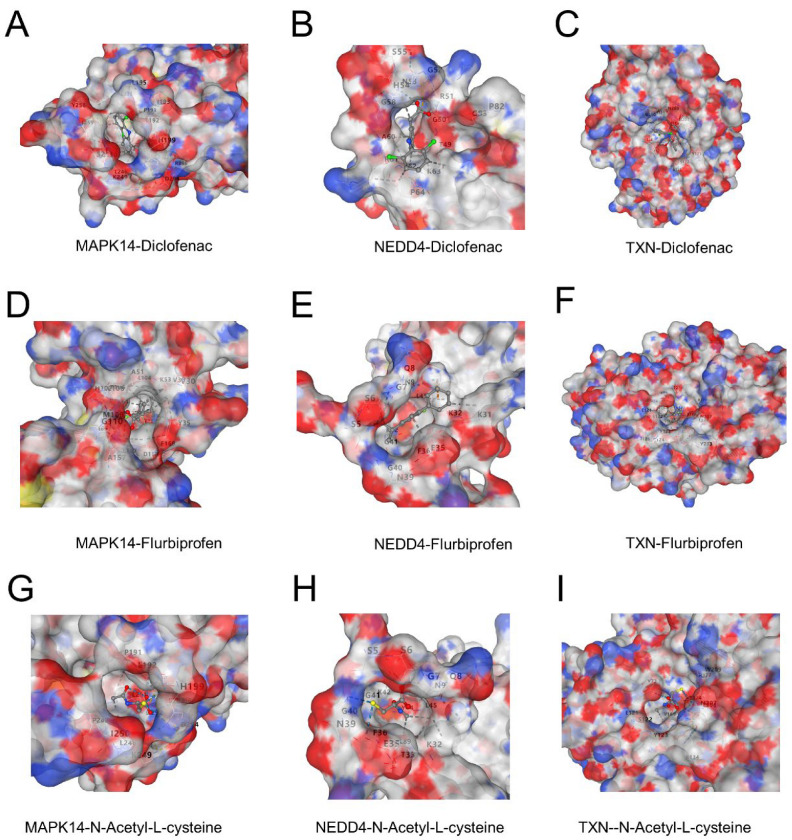
Background: Sepsis is a life-threatening condition characterized by organ dysfunction due to an imbalanced immune response to infection, with high mortality. Ferroptosis, an iron-dependent cell death process, and cellular senescence, which exacerbates inflammation, have recently been implicated in sepsis pathophysiology. Methods: Weighted gene co-expression network analysis (WGCNA) was used to identify ferroptosis- and senescence-related gene modules in sepsis. Differentially expressed genes (DEGs) were analyzed using public datasets (GSE57065, GSE65682, and GSE26378). Receiver operating characteristic (ROC) analysis was performed to evaluate their diagnostic potential, while single-cell RNA sequencing (scRNA-seq) was used to assess their immune-cell-specific expression. Molecular docking was conducted to predict drug interactions with key proteins. Results: Five key genes (CD82, MAPK14, NEDD4, TXN, and WIPI1) were significantly upregulated in sepsis patients and highly correlated with immune cell infiltration. MAPK14 and TXN exhibited strong diagnostic potential (AUC = 0.983, 0.978). Molecular docking suggested potential therapeutic interactions with diclofenac, flurbiprofen, and N-acetyl-L-cysteine. Conclusions: This study highlights ferroptosis and senescence as critical mechanisms in sepsis and identifies promising biomarkers for diagnosis and targeted therapy. Future studies should focus on clinical validation and precision medicine applications.

Keywords: ferroptosis; senescence; sepsis.


Conflict of interest statement

The authors declare no conflicts of interest.

Figures

Figure 1
Figure 1
(A) A heatmap of differentially expressed genes (DEGs) across the merged dataset. The rows represent genes, and the columns represent samples. Red and blue indicate high and low expression levels, respectively. (B) Volcano plot of DEGs from the merged dataset. Significantly upregulated (red) and downregulated (green) genes are shown (|logFC| > 0.6, adjusted p-value < 0.05).
Figure 2
Figure 2
(A,B) The selection of soft-thresholding powers for GSE65682 (A) and GSE57065 (B). The selected powers (7 for (A), 6 for (B)) ensured scale-free topology with sufficient mean connectivity. (C,D) Gene clustering dendrograms and module assignments for GSE65682 (C) and GSE57065 (D). Modules are represented by distinct colors, and similar modules were merged on the basis of eigengene similarity. (E,F) Heatmaps of module–trait correlations for GSE65682 (E) and GSE57065 (F). Each cell shows the Pearson correlation coefficient and p-value.
Figure 3
Figure 3
(AE) The expression of the five intersecting genes (CD82, MAPK14, NEDD4, TXN, and WIPI1) in the merged dataset (GSE57065 and GSE65682). Violin plots revealed significantly greater expression levels in the sepsis group than in the control group (*** p < 0.001). (FJ) Validation of the five genes in the independent dataset (GSE26378). Like in the merged dataset, all five genes (CD82, MAPK14, NEDD4, TXN, and WIPI1) were significantly upregulated in the sepsis group (*** p < 0.001).
Figure 4
Figure 4
(AE) ROC curves for the five intersecting genes (CD82, MAPK14, NEDD4, TXN, and WIPI1) in the merged dataset (GSE57065 and GSE65682). The AUC values and 95% confidence intervals indicate excellent diagnostic accuracy for all genes. (FJ) ROC curves for the same five genes in the validation dataset (GSE26378). Similar to the merged dataset, all genes exhibited high diagnostic performance, with MAPK14 and TXN achieving the highest AUC values.
Figure 5
Figure 5
(A) Nomogram for the diagnostic prediction model. The contribution of each gene (TXN, MAPK14, WIPI1, CD82, and NEDD4) and clinical information are represented, and the total points correspond to the predicted risk of sepsis. (B) Calibration curve for the prediction model. The apparent line (dotted) and bias-corrected line (solid) show the agreement between the predicted probabilities and actual outcomes. The ideal line represents perfect calibration. (C) Receiver operating characteristic (ROC) curve for the prediction model. The AUC value of 0.996 demonstrates excellent discriminative performance. (D) Decision curve analysis (DCA) showing the net benefit of the prediction model across different high-risk thresholds. The red line (model) outperforms the “all” (gray) and “none” (black) strategies, highlighting the model’s clinical utility.
Figure 6
Figure 6
(A) A heatmap showing the Spearman correlation coefficients between the expression levels of the five intersecting genes (CD82, MAPK14, NEDD4, TXN, and WIPI1) and immune cell fractions. Positive correlations are indicated in blue, negative correlations are in red, and statistically significant correlations are marked with asterisks (* p < 0.05). (B) A network plot illustrating the interactions between immune cells and the five intersecting genes. The blue edges represent positive correlations, whereas the red edges indicate negative correlations. The edge thickness reflects the strength of the correlation. (CF) Lollipop plots illustrating the correlation coefficients between CD82 (C), MAPK14 (D), NEDD4 (E), and TXN (F) and immune cell fractions derived from the CIBERSORT analysis. The x-axis represents the correlation coefficients, whereas the y-axis represents the immune cell types. Each dot represents the strength of the correlation for a specific immune cell type, with the corresponding bars extending to the x-axis.
Figure 7
Figure 7
(A,B) t-SNE plots illustrating cell clustering (A) and cell type annotation on the basis of canonical markers (B). The colors represent distinct clusters, and the labels indicate the cell types. (C) Heatmap showing the distribution of cell clusters and their associated cell types identified through single-cell RNA sequencing analysis. The color intensity represents the score of each cluster corresponding to specific cell types, including NK cells, B cells, monocyte cells, and others. (D) t-SNE plots displaying the expression patterns of CD82, MAPK14, NEDD4, TXN, and WIPI1. Red indicates increased expression, and gray indicates decreased expression.
Figure 8
Figure 8
(AC) Binding interactions of diclofenac with MAPK14 (A), NEDD4 (B), and TXN (C). The surface representation highlights the ligand docked in the active site, showing key hydrophobic and electrostatic interactions. (DF) Binding interactions of flurbiprofen with MAPK14 (D), NEDD4 (E), and TXN (F). The ligand forms stable interactions in the active sites of the proteins, with notable hydrogen bonds in NEDD4. (GI) Binding interactions of N-acetyl-L-cysteine with MAPK14 (G), NEDD4 (H), and TXN (I). The interactions are dominated by hydrogen bonding, contributing to moderate binding affinities.

Similar articles

References

    1. Singer M., Deutschman C.S., Seymour C.W., Shankar-Hari M., Annane D., Bauer M., Bellomo R., Bernard G.R., Chiche J.-D., Coopersmith C.M., et al. The Third International Consensus Definitions for Sepsis and Septic Shock (Sepsis-3) JAMA. 2016;315:801–810. doi: 10.1001/jama.2016.0287. - DOI - PMC - PubMed
    1. Gotts J.E., Matthay M.A. Sepsis: Pathophysiology and clinical management. BMJ. 2016;353:i1585. doi: 10.1136/bmj.i1585. - DOI - PubMed
    1. Rudd K.E., Johnson S.C., Agesa K.M., Shackelford K.A., Tsoi D., Kievlan D.R., Colombara D.V., Ikuta K.S., Kissoon N., Finfer S., et al. Global, regional, and national sepsis incidence and mortality, 1990–2017: Analysis for the Global Burden of Disease Study. Lancet. 2020;395:200–211. doi: 10.1016/S0140-6736(19)32989-7. - DOI - PMC - PubMed
    1. Wang W., Liu C.F. Sepsis heterogeneity. World J. Pediatr. 2023;19:919–927. doi: 10.1007/s12519-023-00689-8. - DOI - PubMed
    1. Cecconi M., Evans L., Levy M., Rhodes A. Sepsis and septic shock. Lancet. 2018;392:75–87. doi: 10.1016/S0140-6736(18)30696-2. - DOI - PubMed

LinkOut - more resources