. 2025 Apr 18;13(4):992.
doi: 10.3390/biomedicines13040992.

Druggability Studies of Benzene Sulfonamide Substituted Diarylamide (E3) as a Novel Diuretic

Affiliations

Druggability Studies of Benzene Sulfonamide Substituted Diarylamide (E3) as a Novel Diuretic

Hang Zhang et al. Biomedicines. .

Abstract

Background/Objectives: Urea transporters (UTs) play an important role in the urine-concentrating mechanism and have been regarded as a novel drug target for developing salt-sparing diuretics. Our previous studies found that diarylamides 1H and 25a are specific UT inhibitors and have oral diuretic activity. However, these compounds necessitate further optimization and comprehensive druggability studies. Methods: The optimal compound was identified through structural optimization. Experiments were conducted to investigate its UT inhibitory activity and evaluate its diuretic effect. Furthermore, disease models were utilized to assess the compound's efficacy in treating hyponatremia. Pharmacokinetic studies were performed to examine its metabolic stability, and toxicity tests were conducted to evaluate its safety. Results: Based on the chemical structure of compound 25a, we synthesized a novel diarylamide compound, E3, by introducing a benzenesulfonamide group into its side chain. E3 exhibited dose-dependent inhibition of UT at the nanomolar level and demonstrated oral diuretic activity without causing electrolyte excretion disorders in both mice and rats. Experiments on UT-B-/- and UT-A1-/- mice indicated that E3 enhances the diuretic effect primarily by inhibiting UT-A1 more effectively than UT-B. Furthermore, E3 displayed good metabolic stability and favorable pharmacokinetic characteristics. E3 significantly ameliorated hyponatremia through diuresis in a rat model. Importantly, E3 did not induce acute oral toxicity, subacute oral toxicity, genotoxicity, or cardiotoxicity. Conclusions: Our study confirms that E3 exerts a diuretic effect by specifically inhibiting UTs and has good druggability, which offers potential for E3 to be developed into a new diuretic for the treatment of hyponatremia.

Keywords: diuretic; hyponatremia; pharmacokinetic; safety evaluation; structure optimization; urea transporter inhibitor.


Conflict of interest statement

The authors Jing Li and Yinglin Zuo were employed by the company Sunshine Lake Pharma Co., Ltd. The remaining authors declare that the research was conducted in the absence of any commercial or financial relationships that could be construed as a potential conflict of interest.

Figures

Figure 1
Figure 1
Inhibition activity of E3 on UT-B and UT-A1. (A) Chemical structure of 25a and E3. (B) Erythrocyte lysis percentage in wild-type (WT) and UT-B knockout (UT-B−/−) mice. (C) Erythrocyte lysis percentage in rats, rabbits, and humans. (D) IC50 value of E3 on UT-B-facilitated urea transport in mice, rats, rabbits, and humans. (E) Effect of E3 on UT-B-mediated urea influx, (F) effect of E3 on UT-B-mediated urea efflux, and (G) reversibility of UT-B inhibition were measured by stopped-flow light scattering. (H) Inhibition rate of E3 against UT-A1 and UT-B mediated urea permeability in UT-A1-MDCK and UT-B-MDCK cells. Data are presented as mean ± SEM (n = 3).
Figure 2
Figure 2
Diuretic effects of single intragastric administration of E3 in mice and rats. (A) Urine output of mice. (B) Urine output of rats. (C) Urinary osmolality of mice. (D) Urinary osmolality of rats. (E) Urinary urea concentration of mice. (F) Urinary urea concentration of rats. (G) Excretion of non-urea solutes of mice. (H) Excretion of non-urea solutes of rats. (I) Urine output of UT-A1−/− and UT-B−/− mice. (J) Urinary osmolality of UT-A1−/− and UT-B−/− mice. (K) Urinary urea concentration of UT-A1−/− and UT-B−/− mice. (L) Excretion of non-urea solutes of UT-A1−/− and UT-B−/− mice. Data are presented as mean ± SEM (n = 6). * p < 0.05, ** p < 0.01 and *** p < 0.001, E3 20 mg/kg vs. Ctr. # p < 0.05, ## p < 0.01 and ### p < 0.001, E3 4 mg/kg vs. Ctr. $ p < 0.05, E3 0.8 mg/kg vs. Ctr.
Figure 3
Figure 3
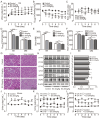
Long-term diuretic effect of E3 in mice and rats. (A) Urine output, (B) urine osmolality, (C) excretion of non-urea solutes, (D) osmolality in renal medulla tissues, (E) urea concentration in renal medulla tissues, (F) concentration of non-urea solutes in renal medulla tissues. (G) H&E-stained kidney tissue sections. (H) Representative Western blotting of UTs and AQPs in renal medulla homogenate. (I) The relative protein expression levels of rats receiving consecutive administrations of E3 at 4 and 20 mg/kg, data are presented as mean ± SEM (n = 4). (J) Urine output of mice. (K) Urine output of UT-A1−/− and UT-B−/− mice. (L) Urinary osmolality of UT-A1−/− and UT-B−/− mice. OM, outer medulla; IM, inner medulla. Data are presented as mean ± SEM (n = 6). * p < 0.05, ** p < 0.01 and *** p < 0.001, E3 20 mg/kg vs. Ctr. # p < 0.05, ## p < 0.01 and ### p < 0.001, E3 4 mg/kg vs. Ctr. ns, no significance.
Figure 4
Figure 4
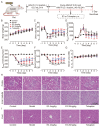
The effect of E3 on the SIADH model. (A) Experimental scheme for establishing the SIADH model. (B) Body weight. (C) Urine output. (D) Urine osmolality. (E) Serum osmolality. (F) Serum sodium concentration. (G) Serum urea concentration. (H) Representative images of kidney tissue sections. (I) Representative images of liver tissue sections. Data are presented as mean ± SEM (n = 6). * p < 0.05, ** p < 0.01 and *** p < 0.001, model vs. Ctr. # p < 0.05 and ## p < 0.01, ### p < 0.001 E3 4 mg/kg vs. model. # p < 0.05, ## p < 0.01, ### p < 0.001, E3 20 mg/kg vs. model. # p < 0.05, ## p < 0.01, ### p < 0.001, tolvaptan vs. model.
Figure 5
Figure 5
The pharmacokinetic profiles of E3. (A) Stability of E3 in the plasma of various species. (B) Stability of E3 in simulated gastric fluid (SGF) and simulated intestinal fluid (SIF). (C) Stability of E3 in mouse and rat liver microsomes. Data are presented as mean ± SD (n = 3). (D) Mean plasma concentration of E3 in SD rats after a single i.v. dose at 1 mg/kg body weight. (E) Single p.o. dose at 4 mg/kg body weight. (F) Tissue distribution of E3 in SD rats after a single oral dose at 4 mg/kg. Data are presented as mean ± SEM (n = 5).
Figure 6
Figure 6
Subacute oral toxicity assay in mice. (A) Body weight. (B) Organ indexes. (C) Representative M-mode images at the parasternal long axis. (D) Left ventricular ejection fraction. (E) Left ventricular fractional shortening. (F) H&E staining of tissues from the brain, lung, heart, spleen, liver, kidney, and testis. (G) Blood biochemical indexes, including ALT, AST, Scr, urea, total cholesterol (TC), triglycerides (TG), and creatine kinase (CK). Data are presented as mean ± SEM (n = 9). ns, no significance.
Figure 7
Figure 7
Male reproductive toxicity detection and safety analysis of E3. (A) Testicular and epididymal indexes. (B) Sperm motility. (C) Sperm abnormality. (D) The representative photographs of sperm stained with eosin. (E) Sperm count. (F) Representative images of testicular H&E staining. (G) Johnsen score of the seminiferous tubules. Data are presented as mean ± SEM (n = 6). ns, no significance. ** p < 0.01 and *** p < 0.001, vs. Ctr.

Similar articles

Cited by

References

    1. Inker L.A., Grams M.E., Levey A.S., Coresh J., Cirillo M., Collins J.F., Gansevoort R.T., Gutierrez O.M., Hamano T., Heine G.H., et al. Relationship of Estimated GFR and Albuminuria to Concurrent Laboratory Abnormalities: An Individual Participant Data Meta-analysis in a Global Consortium. Am. J. Kidney Dis. 2019;73:206–217. doi: 10.1053/j.ajkd.2018.08.013. - DOI - PMC - PubMed
    1. Chatur S., Vaduganathan M., Claggett B., Vardeny O., Desai A.S., Jhund P.S., de Boer R.A., Lam C.S.P., Kosiborod M.N., Shah S.J., et al. Dapagliflozin and diuretic utilization in heart failure with mildly reduced or preserved ejection fraction: The DELIVER trial. Eur. Heart J. 2023;44:2930–2943. doi: 10.1093/eurheartj/ehad283. - DOI - PMC - PubMed
    1. Wang B., Wen D., Li H., Wang-France J., Sansom S.C. Net K(+) secretion in the thick ascending limb of mice on a low-Na, high-K diet. Kidney Int. 2017;92:864–875. doi: 10.1016/j.kint.2017.04.009. - DOI - PMC - PubMed
    1. Shankar S.S., Brater D.C. Loop diuretics: From the Na-K-2Cl transporter to clinical use. Am. J. Physiol.-Ren. Physiol. 2003;284:F11–F21. doi: 10.1152/ajprenal.00119.2002. - DOI - PubMed
    1. Tamargo J., Segura J., Ruilope L.M. Diuretics in the treatment of hypertension. Part 2: Loop diuretics and potassium-sparing agents. Expert Opin. Pharmacother. 2014;15:605–621. doi: 10.1517/14656566.2014.879117. - DOI - PubMed

LinkOut - more resources