

Spatial distribution and determinants of micronutrient intake status among children aged 6-23 months in Ethiopia: A Multi-scale Geographical Weighted Regression Analysis
- PMID: 40299960
- PMCID: PMC12040264
- DOI: 10.1371/journal.pone.0321113
Spatial distribution and determinants of micronutrient intake status among children aged 6-23 months in Ethiopia: A Multi-scale Geographical Weighted Regression Analysis
Abstract
Introduction: Micronutrient (MN) deficiency is a major global health concern, especially in developing countries like Ethiopia. However, there is a lack of comprehensive monitoring and information regarding MN intake status. This study aimed to assess the spatial distribution and factors influencing the intake of MN-rich foods among children aged 6-23 months in Ethiopia.
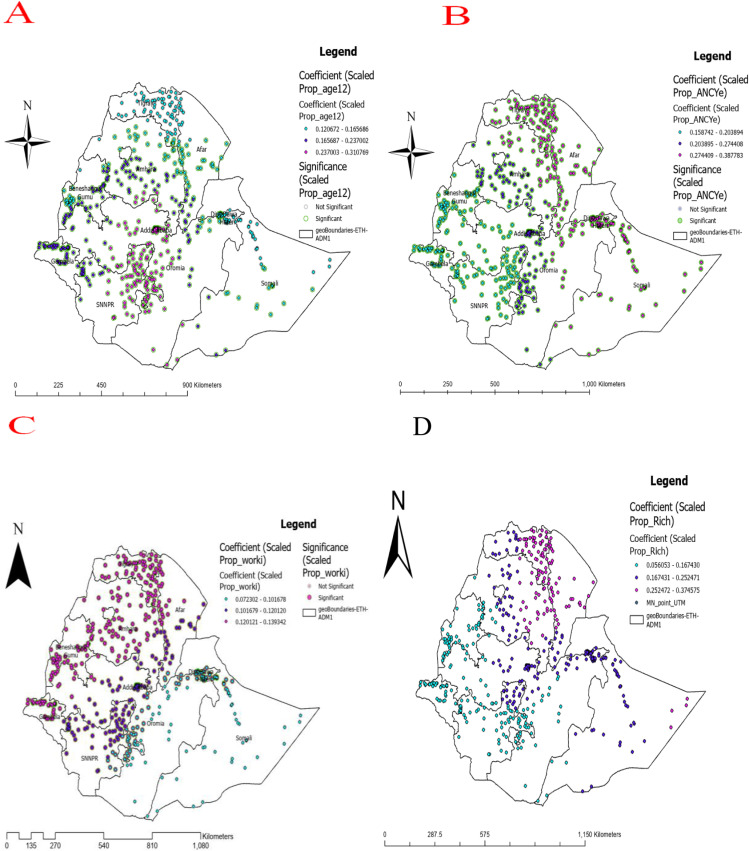
Methods: This study utilized the Ethiopian 2016 Demographic and Health Survey dataset with 2562 weighted children. The Bernoulli model was applied using Kuldorff's SaTScan version 9.6 software. The spatial distributions of MN-rich food intake were visualized using ArcGIS pro version 3.0 software. Model comparison was conducted using log likelihood ratio and corrected Akakie Information Criteria. A multi-scale geographical weighted regression analysis was performed using MGWR version 2.0 software. A P-value threshold of less than 0.05 was used to identify spatially significant predictors.
Results: Overall, 69% (95% CI: 60.87, 77.43) of children aged 6-23 months in Ethiopia were found to have consumed foods rich in MN. The intake of these nutrient-rich foods exhibited significant clustering in specific regions, including Addis Ababa, Dire Dawa, Harari, certain parts of Benishangul, and the Gambella region. Spatial scan statistics analysis identified a total of 65 primary spatial clusters. Children residing within the primary clusters were found to be 29% more likely to have an intake of foods rich in MN compared to those living outside the identified clusters (RR = 1.29, LLR = 25.34, P < 0.001). Key spatially significant predictors included higher household wealth status; children aged 13-23 months, the presence of antenatal care, and mothers with any job.
Conclusion: The consumption of foods rich in MN in Ethiopia displayed non-random spatial patterns. To tackle the problem of inadequate intake of these nutritious foods and address the burden of MN deficiency among children aged 6-23 months, it is essential for policymakers and health planners to implement targeted nutrition interventions in the identified areas and factors.
Copyright: © 2025 Zemariam et al. This is an open access article distributed under the terms of the Creative Commons Attribution License, which permits unrestricted use, distribution, and reproduction in any medium, provided the original author and source are credited.
Conflict of interest statement
The authors have declared that no competing interests exist.
Figures


References
-
- Katti S. Hunger and malnutrition in children. J Glob Values 9(1).
-
- Harika R, Faber M, Samuel F, Kimiywe J, Mulugeta A, Eilander A. Micronutrient status and dietary intake of iron, vitamin a, iodine, folate and zinc in women of reproductive age and pregnant women in Ethiopia, Kenya, Nigeria and South Africa: a systematic review of data from 2005 to 2015. Nutrients. 2017;9(10):1096. doi: 10.3390/nu9101096 - DOI - PMC - PubMed
-
- The Federal Democratric Republic of Ethiopia. Government of Ethiopia National Nutrition Program, 2016-2020. July 2016.
MeSH terms
Substances
LinkOut - more resources
Full Text Sources
