. 2025 Apr 29;23(4):e3003115.
doi: 10.1371/journal.pbio.3003115. eCollection 2025 Apr.

Variant mutation G215C in SARS-CoV-2 nucleocapsid enhances viral infection via altered genomic encapsidation

Affiliations

Variant mutation G215C in SARS-CoV-2 nucleocapsid enhances viral infection via altered genomic encapsidation

Hannah C Kubinski et al. PLoS Biol. .

Abstract

The evolution of SARS-CoV-2 variants and their respective phenotypes represents an important set of tools to understand basic coronavirus biology as well as the public health implications of individual mutations in variants of concern. While mutations outside of spike are not well studied, the entire viral genome is undergoing evolutionary selection, with several variants containing mutations in the central disordered linker region of the nucleocapsid (N) protein. Here, we identify a mutation (G215C), characteristic of the Delta variant, that introduces a novel cysteine into this linker domain, which results in the formation of a more stable N-N dimer. Using reverse genetics, we determined that this cysteine residue is necessary and sufficient for stable dimer formation in a WA1 SARS-CoV-2 background, where it results in significantly increased viral growth both in vitro and in vivo. Mechanistically, we show that the N:G215C mutant has more encapsidation as measured by increased RNA binding to N, N incorporation into virions, and electron microscopy showing that individual virions are larger, with elongated morphologies.


Conflict of interest statement

I have read the journal’s policy and the authors of this manuscript have the following competing interests: HCK, HWD, BAJ, VDM, and EAB have filed a patent on the use of mutations in the nucleocapsid linker as a means of increasing nucleocapsid protein levels. VDM has filed a patent on the reverse genetics system and reporter SARS-CoV-2. Other authors declare no competing interests.

Figures
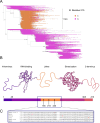
Fig 1
Fig 1. Introduction of novel cysteine residues into the SARS-Co-2 nucleocapsid linker.
(A) Amino acid identity of position 215 in the SARS-CoV-2 nucleocapsid protein in genomic surveillance data from 7,342,041 sequences in The International Nucleotide Sequence Database Collaboration is shown (Glycine in pink, Cysteine in orange). Sequences were visualized by Taxonium11 on January 10th, 2024, at position 215 of the N protein. The tree was rooted to Wuhan/Hu-1 (GenBank MN908947.3, RefSeq NC_045512.2), sequences were added to the tree through the use of UShER12, and Pangolin lineage identity is labeled (B.1617.2 branch shows Delta sequences and B.1.1.529 shows Omicron sequences). (B) The SARS-CoV-2 N protein includes an unstructured N-terminus (residues 1−45; in indigo), an N-terminal RNA binding domain (NTD; residues 45−176; in violet, PDB code 6YI3 [80]), an unstructured linker (LKR) region (176−263, shown in yellow) which binds to Nsp3, and a C-terminal dimerization domain (CTD; residues 263−365; in pink, PDB code: 6WZO [9]), followed by an unstructured C-terminal region (residues 265−419; in peach). (C) The sequences of the Nucleocapsid linker region from SARS-CoV-1 (WA1), the Beta, Delta, and Iota isolates used in this paper, as well as SARS-CoV and MERS were aligned using Clustal Omega. Cysteines are highlighted in red, and arrows highlight their position in the schematic. Figure created with Biorender.
Fig 2
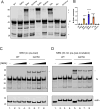
Fig 2. A disulfide-bonded nucleocapsid dimer is formed in several Variants of Concern.
VeroE6-TMPRSS2 cells were infected with the indicated SARS-CoV-2 variants (or WA1, termed Wild type) at an MOI of 0.01 for 24 h. (A) Unreduced cell lysates were visualized by SDS-PAGE and western blot using antibodies recognizing SARS-CoV-2 N. The presence of a ~100 kDa band recognized by the SARS-CoV-2 N antibody in the Beta, Delta, and Iota variants is indicated by an asterisk (*). A representative gel and (B) the relative levels of N dimer to monomer from three independent biological replicates are shown. Mean ± SEM is plotted, individual data points for each experiment are superimposed onto bar graphs for each condition. Statistical comparisons were conducted using a one-way ANOVA with Dunnett’s multiple comparisons, ****=p < 0.0001. (C) VeroE6-TMPRSS2 cells were infected with WT or the G215C virus at an MOI of 0.01 for 24 h. Cell lysates were harvested in standard triton lysis buffer (lanes 1, 5) or in the presence of increasing concentrations of N-ethylmaleimide (1, 10, 100 mM). (D) A parallel experiment was performed in which cells were pre-treated by incubating for 30 min at 37°C in increasing concentrations (1, 10, 100 mM) of NEM in PBS. Cells were then lysed as in (C), with NEM present in the lysis buffer as well as the pre-incubation. Lysates were visualized by SDS-PAGE and western blot using antibodies to SARS-CoV-2 N and actin. The presence of a ~100 kDa band recognized by the SARS-CoV-2 N antibody in the G215C mutant is indicated by an asterisk (*). A representative western blot from two independent biological experiments is shown. The data underlying this Figure can be found in S1 Data.
Fig 3
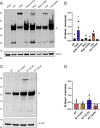
Fig 3. N-linker cysteine residues are necessary and sufficient for stable dimer formation.
(A) HEK-293T cells were transfected with plasmids encoding the N protein of the indicated SARS-CoV-2 variant. In addition, cells were transfected with constructs in which each cysteine was changed back to the parental residue in the WT (WA1) sequence. Twenty-four hours post transfection, unreduced cell lysates were visualized by SDS-PAGE and western blot using antibodies recognizing SARS-CoV-2 N and β-actin. (B) The ratio of N monomer to dimer bands seen in the western blot shown in (A) was quantified. (C) HEK-293T cells were transfected with plasmids encoding the WT N protein or constructs introducing a cysteine at positions 185, 215, or 243, and (D) the ratio of monomer to dimer bands was quantified. The presence of a ~100 kDa band recognized by the SARS-CoV-2 N antibody corresponding to the stable dimer is indicated by a *. A representative western from four (A/B) or three (C/D) independent biological experiments is shown, probed for N (red) and β-actin (green). Mean ± SEM is plotted and individual data points for each experiment are superimposed onto bar graphs for each condition. Statistical comparisons were conducted using a one-way ANOVA with Dunnett’s multiple comparisons, **=0.0056. The data underlying this Figure can be found in S1 Data.
Fig 4
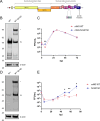
Fig 4. The introduction of N:G215C in a WA1 infectious clone recapitulates stable N dimer formation and displays altered growth kinetics in HBECs.
(A) A schematic of the SARS-CoV-2 genome encoding the mNG infectious clone system is shown, including the replacement of ORF7a with mNeon Green, and the introduction of the G215C mutation in N. (B) VeroE6-TMPRSS2 cells were infected, or mock infected, with the WT or N:G215C viruses at an MOI of 0.0005 for 1 h. Seventy-two hpi, unreduced cell lysates were collected and visualized by SDS-PAGE and western blot using a rabbit anti-SARS-CoV-2 N and β-actin. The presence of the higher MW (~100 kDa) band seen in the N:G215C virus is indicated with a *. A representative gel from three independent biological experiments is shown. (C) In addition, viral supernatants were collected at 8, 24, 32, 48, and 72 h post infection and titered by focus forming assay (FFU; focus forming unit). (D) Human bronchial epithelial cells were infected with WT or N:G215C viruses at an MOI of 0.5 for 1 hour. D) Unreduced cell lysates were collected and processed for western blot as in (B), while (E) apical viral washes were collected sequentially from the same well at 8, 24, 32, 48, and 72 h post infection and titered by focus forming assay (FFU). Mean ± SEM is plotted, N = 6 from three biological experiments (C), N = 12 from four biological experiments (E) is shown. Statistical comparisons were conducted using a two-tailed T test for each time point, (* [p < 0.05], ** [p < 0.01]). Limit of detection (LoD) is 20 FFU/mL and the y-axis minimum is set as the LoD. The data underlying this Figure can be found in S1 Data.
Fig 5
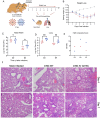
Fig 5. The N:G215C mutation increases viral growth in nasal washes and the lungs of Syrian golden hamsters as well as immune infiltration and damage.
(A) Three- to four-wk-old male hamsters were intranasally infected with PBS alone (mock—gray) or 104 FFU of WT (pink) or N:G215C (blue) m Neon Green (NG) SARS-CoV-2. (B) Weight-loss of infected animals was monitored daily for 7 days post infection. On days 2 and 4 post infection, titer in the nasal wash (C) and right lung (D) was determined. On days 4 and 7 post infection, left lung tissue was harvested, fixed, cut into 5-µM section, stained with hemoxylin and eosin, scored for pathological severity (E), and imaged (F). For weights, graphs represent mean weight change ± SEM. For viral titers, lines represent mean viral titer ± SD. Statistical differences were determined by student T test, *p < 0.05, **p < 0.01. Scale bars are 100 μm. The data underlying this Figure can be found in S1 Data.
Fig 6
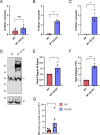
Fig 6. Stably dimerized N is found preferentially in virions and the G215C mutation results in increased viral packaging of N.
(A) HEK-293T cells were transfected with plasmids encoding the WT or G215C N protein. (B) Vero-TMPRSS2 cells were infected with the WT or N:G215C viruses at an MOI of 0.0005 for 1 h. (C) High titer viral stocks of the WT or N:G215C viruses were concentrated by binding to 10% polyethylene glycol (PEG) then centrifugated at 10,000G for 30 min at 4ºC. Unreduced lysates were collected 24 h post transfection, 72 h post infection or directly from the concentrated viral pellet, visualized by SDS-PAGE, and the ratio of N monomer to dimer was quantified. (D) A representative western of (C) is shown, probed for N and M. (E) The ratio of N–M (normalized to the WT N:M ratio for each replicate) is shown, as well as (F) the ratio of N to FFU for each stock (again normalized to the N:FFU ratio in WT virus for each replicate). (G) VeroE6-TMPRSS2 cells were infected with WT or the G215C viruses at an MOI of 0.01 for 48 h. Clarified viral supernatants were concentrated by binding to PEG and centrifuging at 10,000G for 30 min at 4°C. Concentrated virus was lysed and nucleocapsid proteins from each flask were affinity purified. RNA bound to purified nucleocapsid was extracted and RT-cPCR was used to determine the levels of SARS-CoV-2 RNA bound to N for each condition. N = 3 for A–C, N = 4 for D–F, and N = 5 for G. Mean ± SEM is plotted, individual data points for each experiment are superimposed onto bar graphs for each condition. Statistical comparisons were performed using a two-tailed T test, (▪[p = 0.05-0.1), *[p < 0.05], **[p < 0.01], ***[p < 0.001], or ****[p < 0.0001]). The data underlying this Figure can be found in S1 Data.
Fig 7
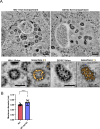
Fig 7. N:G215C virions are enlarged and show over-incorporation of N.
(A) Vero-TMPRSS2 cells were infected with WT or N:G215C viruses at an MOI of 0.1. The following day cells were prepared for electron microscopy by high-pressure freezing and freeze-substitution, then sectioned and imaged by dual-axis electron tomography. Virus-containing exit compartments were located in both samples, and virions that had completely separated from cellular membranes were selected and analyzed in 3D in order to determine the structure of intact virions and the arrangement of internal ribonucleoprotein complexes. (B) The maximum diameter of 20 randomly selected virions for each virus was measured (see S7 Fig). Mean ± SEM is plotted, individual data points for each experiment are superimposed onto bar graphs for each condition. Statistical comparison was performed using a two-tailed T test, **** (p < 0.0001). The data underlying this Figure can be found in S1 Data.
Fig 8
Fig 8. Schematic of how mutations in the nucleocapsid linker may alter the oligomerization status.
The SARS-CoV-2 N protein is composed of RNA-binding (red) and dimerization domains (green), interspersed with flexible unstructured regions at the N and C-termini and a linker region (yellow) in the middle of the protein. Mutations at three separate sites in the central linker region introduce novel cysteines that differentially increase dimerization levels via a disulfide bond. (RNA-binding: PDB code 6YI3 [80], Dimerization Domain PDB code: 6WZO [9]). We propose a conceptual framework that these interactions occur between the linker regions of pairs of N-N dimers and mediate different levels of higher order N-N oligomerization. This figure was made using BioRender.

Update of

References

    1. Cucinotta D, Vanelli M. WHO declares COVID-19 a pandemic. Acta Biomed Atenei Parm. 2020;91(1):157–60. - PMC - PubMed
    1. Plante JA, Liu Y, Liu J, Xia H, Johnson BA, Lokugamage KG, et al.. Spike mutation D614G alters SARS-CoV-2 fitness. Nature. 2021;592(7852):116–21. doi: 10.1038/s41586-020-2895-3 - DOI - PMC - PubMed
    1. Johnson BA, Xie X, Bailey AL, Kalveram B, Lokugamage KG, Muruato A, et al.. Loss of furin cleavage site attenuates SARS-CoV-2 pathogenesis. Nature. 2021;591(7849):293–9. doi: 10.1038/s41586-021-03237-4 - DOI - PMC - PubMed
    1. Liu Y, Liu J, Johnson BA, Xia H, Ku Z, Schindewolf C, et al.. Delta spike P681R mutation enhances SARS-CoV-2 fitness over Alpha variant. Cell Rep. 2022;39(7):110829. doi: 10.1016/j.celrep.2022.110829 - DOI - PMC - PubMed
    1. Vu MN, Lokugamage KG, Plante JA, Scharton D, Bailey AO, Sotcheff S, et al.. QTQTN motif upstream of the furin-cleavage site plays a key role in SARS-CoV-2 infection and pathogenesis. Proc Natl Acad Sci USA. 2022;119(32):e2205690119. doi: 10.1073/pnas.2205690119 - DOI - PMC - PubMed

Substances

Supplementary concepts