

Global, regional, and national disability-adjusted life years and prevalence of lymphatic filariasis from 1990 to 2021: A trend and health inequality analysis based on the global burden of disease study 2021
- PMID: 40300002
- PMCID: PMC12040265
- DOI: 10.1371/journal.pntd.0013017
Global, regional, and national disability-adjusted life years and prevalence of lymphatic filariasis from 1990 to 2021: A trend and health inequality analysis based on the global burden of disease study 2021
Abstract
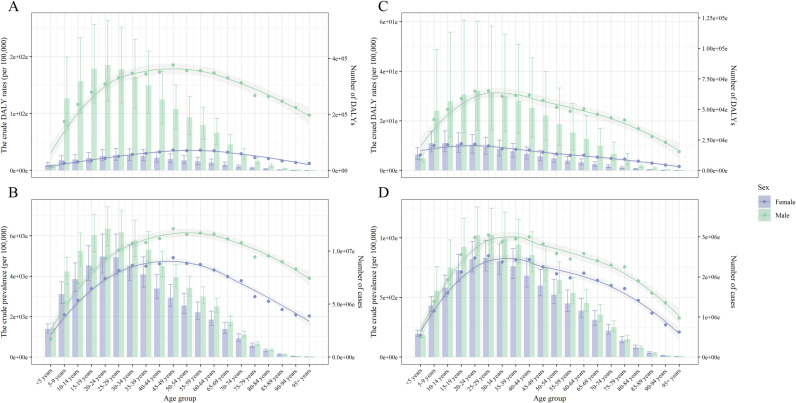
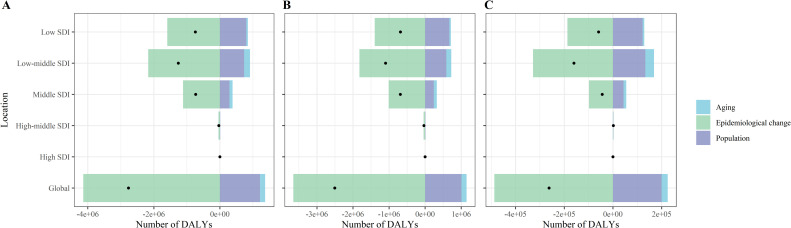
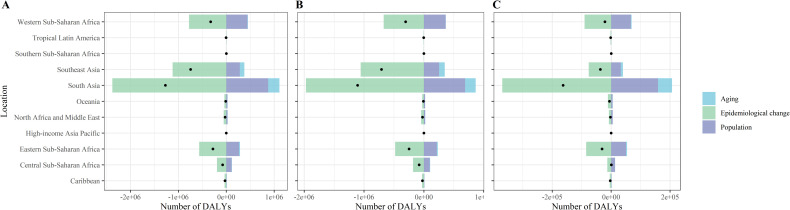
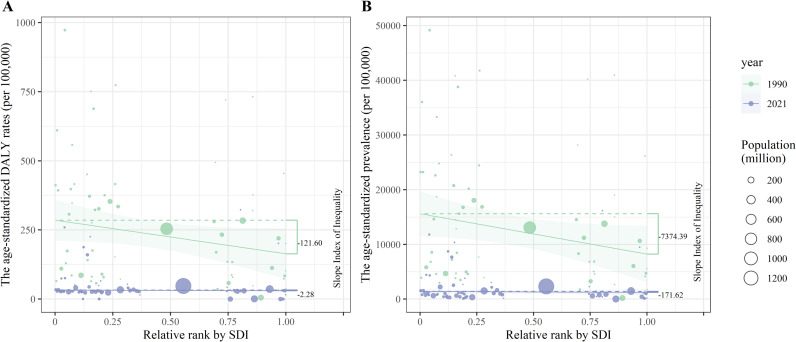
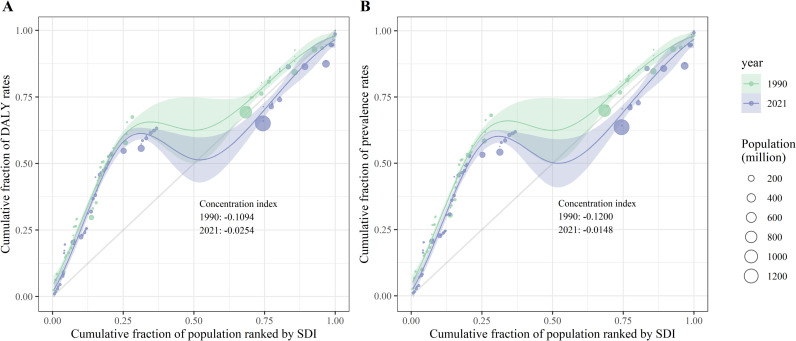
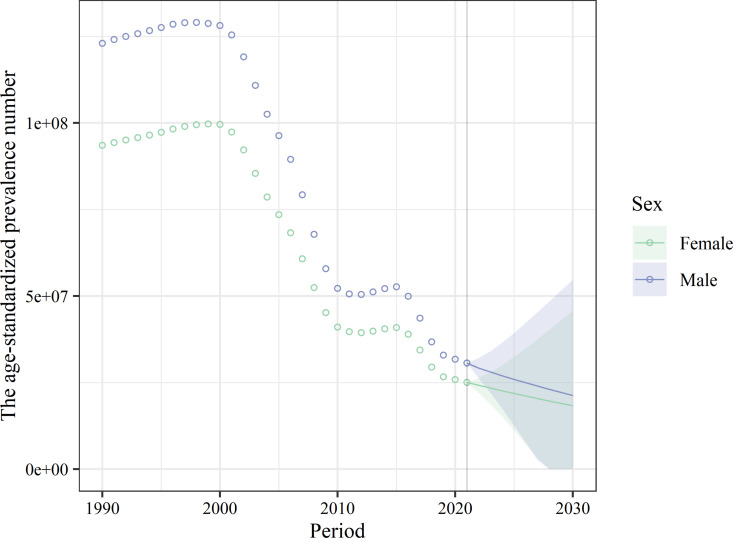
Lymphatic filariasis (LF) is a neglected tropical disease predominantly affecting marginalized populations in resource-limited settings. It can lead to long-term deformities, disabilities, and reduced economic productivity. This study examines differences in Disability-Adjusted Life Year (DALY) and prevalence of LF across countries and regions and predicts future trends. Trends were analyzed based on demographic factors and epidemiological changes, and cross-national health inequalities in LF were quantified. Using data from the Global Burden of Disease (GBD) 2021 database, this study evaluated trends in age-standardized LF DALY rates and prevalence from 1990 to 2021, employing estimated annual percentage change. The study also assessed the relative contributions of aging, population growth, and epidemiological changes in LF burden trends. To quantify absolute and relative cross-country inequalities, the Slope Index of Inequality (SII) and Concentration Index (CI) were applied. Additionally, Bayesian age-period-cohort models were used to predict LF case numbers and prevalence from 2022 to 2030. The findings indicated that, in 2021, LF burden varied by age, sex, and region, with the highest prevalence among individuals aged 15-49 years, males, and populations in low SDI regions. The global age-standardized prevalence and DALY rates of LF declined between 1990 and 2021, and predictions suggest this downward trend will continue through 2030. Potential changes adjusted by aging and population growth were the primary drivers of reductions in the number of LF cases and DALYs. Over the past few decades, the LF burden has concentrated in underdeveloped and disadvantaged regions. However, cross-national inequalities in LF are narrowing rapidly. These results emphasize the urgent need for sustained health interventions and public health policies to eliminate LF, particularly in low-income, high-risk regions such as Oceania. Targeted efforts are essential to improving the health and well-being of marginalized populations.
Copyright: © 2025 Zhao et al. This is an open access article distributed under the terms of the Creative Commons Attribution License, which permits unrestricted use, distribution, and reproduction in any medium, provided the original author and source are credited.
Conflict of interest statement
The authors have declared that no competing interests exist.
Figures

References
-
- Organization WH. Thirteenth meeting of the WHO strategic and technical advisory group for neglected tropical diseases, 15–17 September 2020. 2020.
-
- Organization WH. Integrating neglected tropical diseases into global health and development: fourth WHO report on neglected tropical diseases. World Health Organization; 2017.
-
- Organization WH. Global report on neglected tropical diseases 2023. World Health Organization; 2023.
MeSH terms
LinkOut - more resources
Full Text Sources
Miscellaneous
