. 2025 Apr 29;21(4):e1012950.
doi: 10.1371/journal.pcbi.1012950. eCollection 2025 Apr.

Structure-based mechanism of RyR channel operation by calcium and magnesium ions

Affiliations

Structure-based mechanism of RyR channel operation by calcium and magnesium ions

Alexandra Zahradníková et al. PLoS Comput Biol. .

Abstract

Ryanodine receptors (RyRs) serve for excitation-contraction coupling in skeletal and cardiac muscle cells in a noticeably different way, not fully understood at the molecular level. We addressed the structure of skeletal (RyR1) and cardiac (RyR2) isoforms relevant to gating by Ca2+ and Mg2+ ions (M2+). Bioinformatics analysis of RyR structures ascertained the EF-hand loops as the M2+ binding inhibition site and revealed its allosteric coupling to the channel gate. The intra-monomeric inactivation pathway interacts with the Ca2+-activation pathway in both RyR isoforms, and the inter-monomeric pathway, stronger in RyR1, couples to the gate through the S23*-loop of the neighbor monomer. These structural findings were implemented in the model of RyR operation based on statistical mechanics and the Monod-Wyman-Changeux theorem. The model, which defines closed, open, and inactivated macrostates allosterically coupled to M2+-binding activation and inhibition sites, approximated the open probability data for both RyR1 and RyR2 channels at a broad range of M2+ concentrations. The proposed mechanism of RyR operation provides a new interpretation of the structural and functional data of mammalian RyR channels on common grounds. This may provide a new platform for designing pharmacological interventions in the relevant diseases of skeletal and cardiac muscles. The synthetic approach developed in this work may find general use in deciphering mechanisms of ion channel functions.


Conflict of interest statement

The authors have declared that no competing interests exist.

Figures

Fig 1
Fig 1. The sequences and the molecular structures related to the RyR channel operation.
(A) The block scheme of the rRyR1 C-terminal quarter (3667-5037) for two neighbor monomers. Light blue - the Central domain (CD); light green – the EF-hand region; dark green – EF1 and EF2 motifs; tan – the Divergent region 1 (DR1); yellow – U-motif; light brown – S23 loop; blue – S45 linker (S45); white – the S6 segment with the hinge and gate residues in magenta; orange – the C-terminal domain (CTD). Red arrows – salt bridges between interacting residues of the EF-hand region and the S23* loop. The asterisks indicate a reference to the neighbor RyR monomer located counterclockwise in the top view of the channel. The connectors connect the canonical amino acid residues of the indicated binding sites. (B) Left – the see-through side view of a RyR1 tetramer (Ca-inactivated state, rabbit 7tdg [22]); top – the cytoplasmic side, bottom – the SR luminal side. Right – the detail of regions involved in the RyR operation. Colors correspond to A. Green spheres – Ca atoms at the activation binding sites, and at the ACP (adenosine 5′‐[β,γ‐methylene]triphosphate) molecule bound at the ATP site (center). The brown color indicates the S23* loop of the neighbor monomer. The short red dotted lines correspond to the salt bridges between residues K4101-D4730* and E4075-R4736* (red arrows in A). G - the hinge and gate residues D4934 and I4937 of the S6 segment.
Fig 2
Fig 2. Distances between key amino acid pairs of the EF-hand and S23* in RyR structures.
Left – Distances D1 between the Cα atoms of E4075 and R4736* or equivalent. Right – Distances D2 between the Cα atoms of K4101 and D4730* or equivalent. Circles – RyR1 states. Triangles - RyR2 states. C – closed state, black symbols. P – primed state, blue symbols. O – open state, cyan symbols. I – inactivated state, green symbols. Mg – high-magnesium state, magenta symbols. Short lines – the median values of groups. Long lines – the theoretical maximum distances allowing H-bond formation.
Fig 3
Fig 3. Number of interactions and area between the EF-hand region and S23* loop in RyR structures.
Circles – RyR1 structures; Triangles – RyR2 structures; Black – closed state; Blue – primed state; Cyan – open state; Green – inactivated state; Magenta – high-Mg state. Orange squares – inactivated RyR1 with MH mutations R4736W, R4736Q; Red squares – inactivated RyR1 with MH mutations G4733E, F4732D. RRyR1, RRyR2 – Pearson’s correlation coefficients for RyR1 and RyR2 data groups (solid lines); nRyR1 = 27; nRyR2 = 17; p < 0.005 in both cases). Note: the correlations were calculated without the data for mutated structures (squares). The dashed line extrapolates the correlation line.
Fig 4
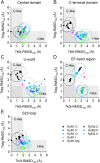
Fig 4. The RMSD analysis of RyR structures.
Horizontal axis – RMSD100 of the RyR structures relative to the closed RyR1 structure 7k0t. Vertical axis – RMSD100 of the RyR structures relative to the inactivated RyR1 structure 7tdg. The circles of 1 Å radius are centered on the mean RMSDs of the corresponding group of RyR isoforms and states and appraise the significance of differences between groups (when the corresponding circles do not intersect the difference is significant). The solid circle data points and the solid circle lines indicate RyR1 data; the solid triangle data points and the dashed circle lines indicate RyR2 data. Colors indicate RyR states (see inset). C-like and I-like grey bands indicate the similarity of RMSD100 values to either the closed or inactivated reference states.
Fig 5
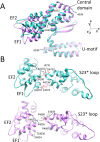
Fig 5. Possible interactions between the EF-hand and S23 in the open RyR1 and RyR2 structures.
A – Overlay of the EF-hand region in the open RyR1 (7m6l, cyan) and RyR2 (7ua9, magenta) structures aligned at their S23 loops (out of the image plane). Note the differences in the EF1 and EF2 positions and almost the same positions of the Central domain and U-motif segments. The RyR1 residue sequence numbers are given for orientation. B – Possible residue interactions between the EF-hand region (left) and S23* loop (right) in the open RyR1 (cyan) and RyR2 (magenta) structures. The structures in B are rotated by 30° counterclockwise about their x, y, and z axes relative to their orientation in A. Dotted red lines -– structurally possible H-bonds between the interacting residues. The spatial arrangement of all primed, open, and inactivated structures is compared for RyR1 and RyR2 in S1 Fig.
Fig 6
Fig 6. The residue importance in the inhibition pathways.
The RI was calculated for all detected inactivation paths and mapped on the RyR sequences. The graph displays only RI > 0.05. The color-coded marks under the sequence axis indicate the positions of important residues from Tables 3 and 4, see the legend at the bottom, where: ACT – Ca2+-binding activation site, INH – M2+-binding inhibition site, ATP – ATP-binding site, CFF – caffeine/xanthine binding site, S23 – S23 loop, S45 – S45 linker, and GATE – channel gating residues.
Fig 7
Fig 7. The residue importance in the activation pathways.
The RI was calculated for all detected activation paths and mapped on the RyR sequences. The graph displays only RI > 0.05. The color-coded marks under the sequence axis indicate the positions of important residues from Tables 3 and 4, see the legend at the bottom: ACT – Ca2+-binding activation site, INH – M2+-binding inhibition site. ATP – ATP-binding site, CFF – caffeine/xanthine binding site, S23 – S23 loop, S45 – S45 linker, GATE – channel gating residues.
Fig 8
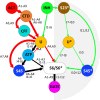
Fig 8. Divalent ion-related allosteric networks of the ryanodine receptor.
The scheme integrates the intra-monomeric (white background) and the inter-monomeric pathways (gray background). Note that both pathway types are present in each monomer. Red – the activation network. Green – the inhibition network. Black – the shared activation and inhibition sub-paths. The branches are labeled in correspondence to Tabs 3–5 - 5. ACT – the activation site; INH – the inhibition site; CTD – the C-terminal domain; CFF – the caffeine binding site; S23 – the S23 loop; U, U* - the U-motifs; ATP – the ATP binding site; S45, S45* - the S45 linkers; S6/S6* - the S6 helices; GATE - the gating site. The spatial arrangement of the pathways of two example structures (the RyR1 inactivated structure 7tdg and the RyR2 open structure 7ua9) is shown in S2 Fig.
Fig 9
Fig 9. The COI model of RyR channel operation.
(A) Transitions between the closed, open, and inactivated macrostates of ligand-free RyR. Equilibrium constants of transitions between the respective macrostates are indicated. (B) The ligand-binding transitions of a monomer in the closed macrostate. (C) The ligand-binding transitions of a monomer in the open macrostate. (D) The ligand-binding transitions of a monomer in the inactivated macrostate. (B – D) Gray shapes represent RyR monomers in the respective macrostates as depicted in A. Equilibrium constants of transitions between the respective states are indicated. Lines and arrows represent the allosteric interaction pathways. Dashed lines - no allosteric regulation. Blunt arrow (Ͱ) - negative allosteric interaction. The pointed arrows (←) - positive allosteric interaction. Round groove – the activation site. Pointed groove – the inhibition site. Blue square – the interaction site of the activation and the intra-monomeric inhibition pathways (ATP-binding site). Red circles – Ca2+; pink circles – Mg2+; green diamonds – M2+ (Ca2+ or Mg2+). Brown shapes labeled G - the channel pore with the gate in the closed, open, or inactivated state. The grey triangle represents the S23 loop of a neighboring monomer.
Fig 10
Fig 10. Description of RyR open probability data by the COI model of RyR operation.
The data points represent the mean and SEM of the single-channel open probability values read from the referenced publications (see below). The curves represent the theoretical predictions of the COI model (Eq. 3) with the corresponding parameters for individual data groups in Table 8. A – Calcium dependence of the single-channel PO at cytosolic [Mg2+] of 0, 600, and 940 µM (indicated next to the data) in the presence of 3 mM cytosolic ATP and 1 mM luminal Ca2+. Black points – canine RyR2 channels [36]. Green points - rat RyR2 channels [61]. Lines - theoretical predictions of the COI model with parameters for the “RyR2 + ATP” group in Table 8. B – Magnesium dependence of the single-channel PO at cytosolic [Ca2+] of 0.1 and 0.41 µM (indicated next to the data) in the presence of 3 mM cytosolic ATP and 1 mM luminal Ca2+. Green points - rat RyR2 channels [61,62]. Lines - theoretical predictions of the COI model with parameters for the “RyR2 + ATP” group in Table 8. C – Calcium dependence of the single-channel open probability obtained in the absence of cytosolic ATP and Mg2+ and with 10 µM luminal Ca2+ [26,63]. Black points - canine RyR2 channels [26]. Blue points - human RyR1 channels [63]. Red points – rabbit RyR1 channels [26]. Lines - theoretical predictions of the COI model with parameters for the “RyR1 − ATP” or “RyR2 − ATP” groups in Table 8.

Similar articles

Cited by

References

    1. Meissner G. The structural basis of ryanodine receptor ion channel function. J Gen Physiol. 2017;149(12):1065–89. doi: 10.1085/jgp.201711878 - DOI - PMC - PubMed
    1. Wagenknecht T, Samsó M. Three-dimensional reconstruction of ryanodine receptors. Front Biosci. 2002;7:d1464-74. doi: 10.2741/A853 - DOI - PubMed
    1. Zahradník I, Györke S, Zahradníková A. Calcium activation of ryanodine receptor channels--reconciling RyR gating models with tetrameric channel structure. J Gen Physiol. 2005;126(5):515–27. doi: 10.1085/jgp.200509328 - DOI - PMC - PubMed
    1. Wilson AD, Hu J, Sigalas C, Venturi E, Valdivia HH, Valdivia CR, et al.. The V2475F CPVT1 mutation yields distinct RyR2 channel populations that differ in their responses to cytosolic Ca2+ and Mg2. J Physiol. 2021;599(23):5179–201. doi: 10.1113/JP281707 - DOI - PMC - PubMed
    1. des Georges A, Clarke OB, Zalk R, Yuan Q, Condon KJ, Grassucci RA, et al.. Structural basis for gating and activation of RyR1. Cell. 2016;167(1):145–57.e17. doi: 10.1016/j.cell.2016.08.075 - DOI - PMC - PubMed

LinkOut - more resources