. 2025 Apr 29;21(4):e1013070.
doi: 10.1371/journal.ppat.1013070. eCollection 2025 Apr.

Rice stripe mosaic virus M protein antagonizes G-protein-induced antiviral autophagy in insect vectors

Affiliations

Rice stripe mosaic virus M protein antagonizes G-protein-induced antiviral autophagy in insect vectors

Ruonan Zhang et al. PLoS Pathog. .

Abstract

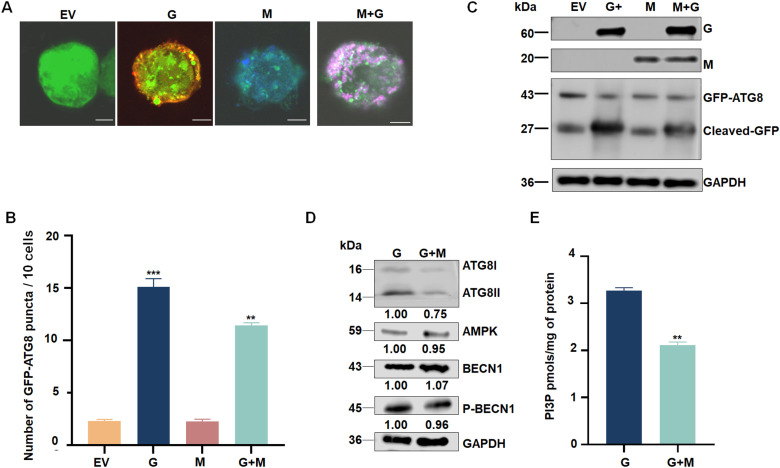
In the field, 80% of plant viruses are transmitted by insect vectors. When ingested by a sap-sucking insect such as Recilia dorsalis, persistently transmitted viruses such as rice stripe mosaic virus (RSMV) infect the gut epithelium and eventually pass to the salivary glands where they will be transmitted to the next rice (Oryza sativa) plant. To efficiently exploit insect vectors for transmission, plant viruses must overcome various immune mechanisms within the vectors, including autophagy. However, understanding how plant viruses overcome insect autophagic defenses remains limited. In this study, we provide evidence that infection with RSMV triggers an autophagic antiviral response in leafhopper cells. In this response, the G protein of RSMV binds to a leafhopper AMP-activated protein kinase (AMPK), leading to enhanced phosphorylation of Beclin-1 (BECN1), thereby inducing autophagy. Knockdown of AMPK and genes encoding members of the phosphoinositide 3-kinase (PI3K) complex composed of the autophagy-related protein 14 (ATG14), BECN1, and vacuolar protein sorting 34 (VPS34) facilitated viral infection in leafhoppers. To suppress leafhopper-induced autophagy, RSMV M protein specifically interacts with ATG14, resulting in the disintegration of PI3K complexes. This leads to reduced phosphatidylinositol-3-phosphate content and thus inhibits the G-protein- induced autophagy. Our study sheds light on the mechanism by which this rice virus evades insect autophagy antiviral defenses.


Conflict of interest statement

The authors have declared that no competing interests exist.

Figures

Fig 1
Fig 1. RSMV infection induces complete autophagy in the midgut epithelium of R. dorsalis.
(A) Immunofluorescence assay showing the colocalization of RSMV-ATG8 in nonviruliferous (panels I-III) or viruliferous (panels IV-VIII) R. dorsalis midguts. Intestine tissues of R. dorsalis were fixed, immunostained with ATG8-FITC (green) and RSMV-G-rhodamine (red) and observed by immunofluorescence microscopy. Panels III, VI, and VIII are the enlarged images of the boxed areas in panels II, V, and VII, respectively. Arrows indicate the colocalization of RSMV G and ATG8. mg, midgut; fc, filter chamber. Bars: 20 μm. (B). Immunoelectron microscopy showing the localization of ATG8, G, or M on autophagosomes in the cytoplasm of epithelial cells of nonviruliferous or viruliferous R. dorsalis midguts, as determined by immunogold labeling. (II-XIII) Intestine tissues of viruliferous R. dorsalis were immunolabeled with G-(II-IV), ATG8-(V-IX), and M-(X-XIII) specific IgG primary antibodies, followed by treatment with goat antibodies against rabbit IgG conjugated with 10-nm-diameter gold particles. Panel II displays RSMV virions immunolabeled with a G-specific antibody. Panels III shows RSMV virions localized around autophagosomes, also immunolabeled with the G-specific antibody. Panels V to IX show the process of RSMV virion entry into autophagosomes, as identified by immunolabeling with an ATG8-specific antibody. Panels X to XIII show the viroplasm of RSMV and RSMV virions positioned around autophagosomes, immunolabeled with an M-specific antibody. Panels IV, VII, IX, and XIII are magnified views of the boxed regions in Panels III, VI, VIII and XII, respectively. Red arrows indicate gold particles, black arrows indicate virus, Ap: autophagosome; DM: Double membrane. Bars: 100 nm. (C and D) The silencing efficiency of ATG8 and viral transcript levels in dsATG8-treated viruliferous individuals, as detected by RT-qPCR at 3 days post-microinjection with dsATG8 or dsGFP. Means (± SE) from three biological replicates are shown. *P < 0.05, ***P < 0.001. (E) Knockdown of ATG8 expression promotes RSMV infection and downregulates ATG8 accumulation, as determined by western blot. ATG8, SQSTM1, LAMP1, and RSMV N, P, and M levels in dsATG8- or dsGFP-treated R. dorsalis were examined by western blot. Relative intensities of bands for ATG8, SQSTM1, LAMP1, and RSMV N, P, and M are shown below. Bands for GAPDH demonstrate the equal loading of proteins. Data are representative of three biological replicates.
Fig 2
Fig 2. RSMV infection promotes the biosynthesis of PI3P.
(A) Model showing that AMPK activates autophagy to generate PI3P by phosphorylating BECN1 in the PI3K complex. PI3P is an important component of the precursor membranes of autophagic vacuoles. (B) Relative transcript levels of AMPK, BECN1, ATG14, and VPS34 in nonviruliferous or viruliferous insects, as detected by RT-qPCR. (C) Relative levels of AMPK, BECN1, ATG14, and phosphorylated BECN1 in nonviruliferous or viruliferous insects, as detected by western blot. Relative intensities of bands for AMPK, BECN1, p-BECN1, and ATG14 are shown below. GAPDH was used as a control. (D) PI3P content in nonviruliferous or viruliferous R. dorsalis, as determined using a PI3P ELISA assay kit. Data are representative of three biological replicates. The raw data are provided in the supplementary material S1 Table. V-: nonviruliferous. V+, viruliferous. *P<0.05, **P<0.01, **, P<0.001.
Fig 3
Fig 3. RSMV G protein induces the antiviral autophagy response in the R. dorsalis vector.
(A) Immunofluorescence assay showing GFP-ATG8 (green) in Sf9 cells co-expressed with an empty vector (EV) as a control, or GFP-ATG8 co-expressed with RSMV proteins (Red) N, P, P3 M, G, P6, or L. Bars, 5 µm. (B) Average number of discrete puncta of GFP-ATG8 in Sf9 cells, as measured in 30 cells. **P < 0.01. (C) ATG8 levels in Sf9 cells expressing G or empty vector, as detected by western blot. GAPDH was used as a control. Data are representative of three biological replicates. (D) ATG8 levels in G protein injected or non-injected insects, as determined by western blot using ATG8-specific IgGs. GAPDH was used as an internal control. Data are representative of three biological replicates. (E) Immunofluorescence assay showing the distribution of ATG8 puncta in midgut epithelial cells of leafhoppers following G protein injection. The intestines from G protein-injected or non-injected R. dorsalis individuals were immunostained with ATG8-rhodamine (red), and then examined by immunofluorescence microscopy. Bars, 30 µm. (F) Average number of autophagosomes per cell in midgut epithelial cells from G protein-injected or non-injected insects. Bars represent means ± SE from more than 10 individual cells. ***P<0.001. G−, G protein non-injected. G+, G protein injected.
Fig 4
Fig 4. RSMV G interacts with AMPK to enhance the phosphorylation of BECN1.
(A and C) Y2H assays showing the interaction of AMPK with G (A) or BECN1 (C). Transformants on SD/-Trp-Leu-Ade-His plates are labeled as follows: +, positive control (pGBKT7-53/pGADT7-T); –, negative control (pGBKT7-Lam/pGADT7-T). DDO, SD -Trp -Leu medium; QDO, SD -Trp -Leu -His -Ade medium. (B and D) Interaction between RSMV G (B) or BECN1 (D) and AMPK of R. dorsalis, as detected by GST pull-down assay. (E) The effect of RSMV G on the AMPK–BECN1 interaction in vitro. G protein promotes interactions between AMPK and BECN1, as shown by affinity-isolation assays. GST-AMPK and His-BECN1 were incubated with glutathione-Sepharose beads, followed by the addition of His-G. When the amount of His-G increased, the binding between AMPK and His-BECN1 increased. (F) In vitro phosphorylation assay using BECN1-specific antibodies to detect the phosphorylation level of BECN1; AMPK and BECN1 were co-incubated as controls to detect phosphorylation. Increasing amounts of G protein were used to detect the degree of BECN1 phosphorylation. As the G protein content increased, the phosphorylation level of BECN1 increased. (G) Relative levels of AMPK, BECN1, and p-BECN1 in G protein-injected or non-injected insects, as detected by western blot. Relative intensities of bands for AMPK, BECN1, and p-BECN1 are shown below. GAPDH was used as a control. Data are representative of three biological replicates. G−, G protein non-injected. G+, G protein-injected. (H) PI3P content in G protein-injected or non-injected R. dorsalis, as determined using a PI3P ELISA assay kit. Data are representative of three biological replicates. ***P<0.001.
Fig 5
Fig 5. Disrupting the PI3K complex decreases the antiviral activity of autophagy.
(A, B, E, F, I, and J) Knockdown of AMPK, BECN1, and ATG14 expression promotes the accumulation of N, P, and M mRNA, as determined by RT-qPCR. The relative transcript levels of AMPK, BECN1, ATG14, and M in dsAMPK-, dsATG14-, dsBECN1- or dsGFP-treated R. dorsalis at 7 days post-first access to diseased plants (padp) are shown. Means (± SE) from 10 R. dorsalis are shown. *P<0.05, **P<0.01, ***P<0.001. (C, G, and K) PI3P contents in R. dorsalis with knockdown of AMPK, BECN1, ATG14, and dsGFP, as determined using a PI3P ELISA assay kit. Data are representative of three biological replicates. ***P<0.001. (D, H, and L) Effect of knockdown of AMPK, BECN1, and ATG14 expression on ATG8, SQSTM1, LAMP1, and RSMV M accumulation, as determined by western blot. Relative intensities of bands for AMPK, BECN1, ATG14, SQSTM1, LAMP1, and RSMV M are shown below. Bands for GAPDH demonstrate the loading of equal amounts of protein. Data are expressed as means from three biological replicates. (M) PI3P content in R. dorsalis treated with wortmannin or PBS, as determined using a PI3P ELISA assay kit. Data are representative of three biological replicates. (N) Relative transcript levels of RSMV N, P, and M in wortmannin-injected and non-injected insects, as detected by RT-qPCR. Bars represent means ± SE from three independent experiments. **P<0.01, ***P<0.001. (O) Relative levels of ATG8, SQSTM1, LAMP1, RSMV N, P, and M in G protein-injected or non-injected insects, as detected by western blot. Relative intensities of bands for ATG8, SQSTM1, LAMP1, N, P, and M are shown below. GAPDH was used as a control. Data are representative of three biological replicates. V, RSMV.
Fig 6
Fig 6. M protein inhibits the autophagy induced by G protein.
(A) Immunofluorescence assay showing GFP-ATG8 (green) in Sf9 cells co-expressing empty vector (EV), G (red), or M (blue) with GFP-ATG8 and G plus M with GFP-ATG8. Bars, 5 μm. (B) The average number of discrete puncta of GFP-ATG8 in Sf9 cells. Bars represent means ± SE from more than 10 individual cells. **P<0.01. ***P<0.001. (C) ATG8 levels in Sf9 cells expressing empty vector, G, M, or G plus M, as detected by western blot. GAPDH was used as a control. Data are representative of three biological replicates. (D) Relative levels of ATG8, AMPK, BECN1, and p-BECN1 in insects injected with G protein or G plus M, as detected by western blot. Relative intensities of bands for ATG8, AMPK, BECN1, and p-BECN1 are shown below. GAPDH was used as a control. Data are representative of three biological replicates. (E) PI3P content in R. dorsalis injected with G or G plus M, as determined using a PI3P ELISA assay kit. Data are representative of three biological replicates. **P<0.01.
Fig 7
Fig 7. M disrupts the interaction between ATG14 and BECN1.
(A) Y2H assays showing the ATG14-N terminal interact with M. Transformants on SD/-Trp-Leu-Ade-His plates are labeled as follows: +, positive control (pGBKT7-53/pGADT7-T); –, negative control (pGBKT7-Lam/pGADT7-T); DDO, SD -Trp -Leu medium; QDO, SD -Trp -Leu -His -Ade medium. (B) Interaction between RSMV M and ATG14 of R. dorsalis detected by GST pull-down assay. (C) Immunoelectron microscopy showing the localization of ATG8 and ATG14 on autophagosomes in the cytoplasm of epithelial cells of nonviruliferous or viruliferous R. dorsalis midguts, as determined by immunogold labeling. Intestine tissues of nonviruliferous or viruliferous R. dorsalis were immunolabeled with ATG8- or ATG14-specific IgG primary antibodies. Panel I show the cytoplasm of epithelial cells of nonviruliferous R. dorsalis midguts were labeled with ATG8-specific antibodies. Panel II-IV show the intestine tissues were then treated with ATG14-specific antibodies. Red arrows indicate gold particles, black arrows indicate virus, Ap: autophagosome; DM: Double membrane. Bars: 100 nm (D) Immunofluorescence microscopy of the intestines of co-infected insect vectors immunostained with RSMV ATG14-rhodamine (red) and RSMV M-FITC (green). Mg, midgut. Bars, 50 μm. (E) Schematic diagram showing that the N-terminus of ATG14 interacts with both M and BECN1. Competitive interactions occurred among M, BECN1, and ATG14, as revealed by affinity-isolation assays. GST-ATG14 and BECN1-His were incubated with glutathione-Sepharose beads, followed by the addition of M-His. The amounts of BECN1-His decreased with increasing binding between ATG14 and M. When the amount of BECN1-His increased, the binding between ATG14 and M was not affected. (F) ATG14, BECN1, and M were expressed alone or co-expressed. Sf9 cells were fixed at 48 hpi and immunolabeled with ATG14- rhodamine (red), BECN1-FITC (green), or M-Alexa Fluor 647 (blue). The images showing single expression or co-expression were merged under a background of transmitted light. Bars: 10 μm.
Fig 8
Fig 8. Proposed model of the induction and suppression of autophagy in insect vectors during RSMV infection.
According to the model, the interaction between RSMV G protein and AMPK facilitates the phosphorylation of BECN1, triggering antiviral autophagy in R. dorsalis. To sustain viral infection, RSMV M protein competitively binds with ATG14, disrupting the PI3K complex and inhibiting autophagy, thereby promoting viral replication.

Similar articles

References

    1. Eigenbrode SD, Bosque-Pérez NA, Davis TS. Insect-Borne Plant Pathogens and Their Vectors: Ecology, Evolution, and Complex Interactions. Annu Rev Entomol. 2018;63:169–91. doi: 10.1146/annurev-ento-020117-043119 - DOI - PubMed
    1. Orlovskis Z, Canale MC, Thole V, Pecher P, Lopes JR, Hogenhout SA. Insect-borne plant pathogenic bacteria: getting a ride goes beyond physical contact. Curr Opin Insect Sci. 2015;9:16–23. doi: 10.1016/j.cois.2015.04.007 - DOI - PubMed
    1. Weintraub PG, Beanland L. Insect vectors of phytoplasmas. Annu Rev Entomol. 2006;51:91–111. doi: 10.1146/annurev.ento.51.110104.151039 - DOI - PubMed
    1. Zhang Y, Ju F. Fighting caterpillar pests and managing agricultural insecticide resistance with Lepidoptera-associated Enterococcus casseliflavus. TIL. 2023;1(3):100042. doi: 10.59717/j.xinn-life.2023.100042 - DOI
    1. Shaw WR, Catteruccia F. Vector biology meets disease control: using basic research to fight vector-borne diseases. Nat Microbiol. 2019;4(1):20–34. doi: 10.1038/s41564-018-0214-7 - DOI - PMC - PubMed

LinkOut - more resources