

Impact of the Wood-Burning Justa Cookstove on Glycated Hemoglobin (HbA1c): A Stepped-Wedge Randomized Trial in Rural Honduras
- PMID: 40300153
- PMCID: PMC12110914
- DOI: 10.1289/EHP15095
Impact of the Wood-Burning Justa Cookstove on Glycated Hemoglobin (HbA1c): A Stepped-Wedge Randomized Trial in Rural Honduras
Abstract
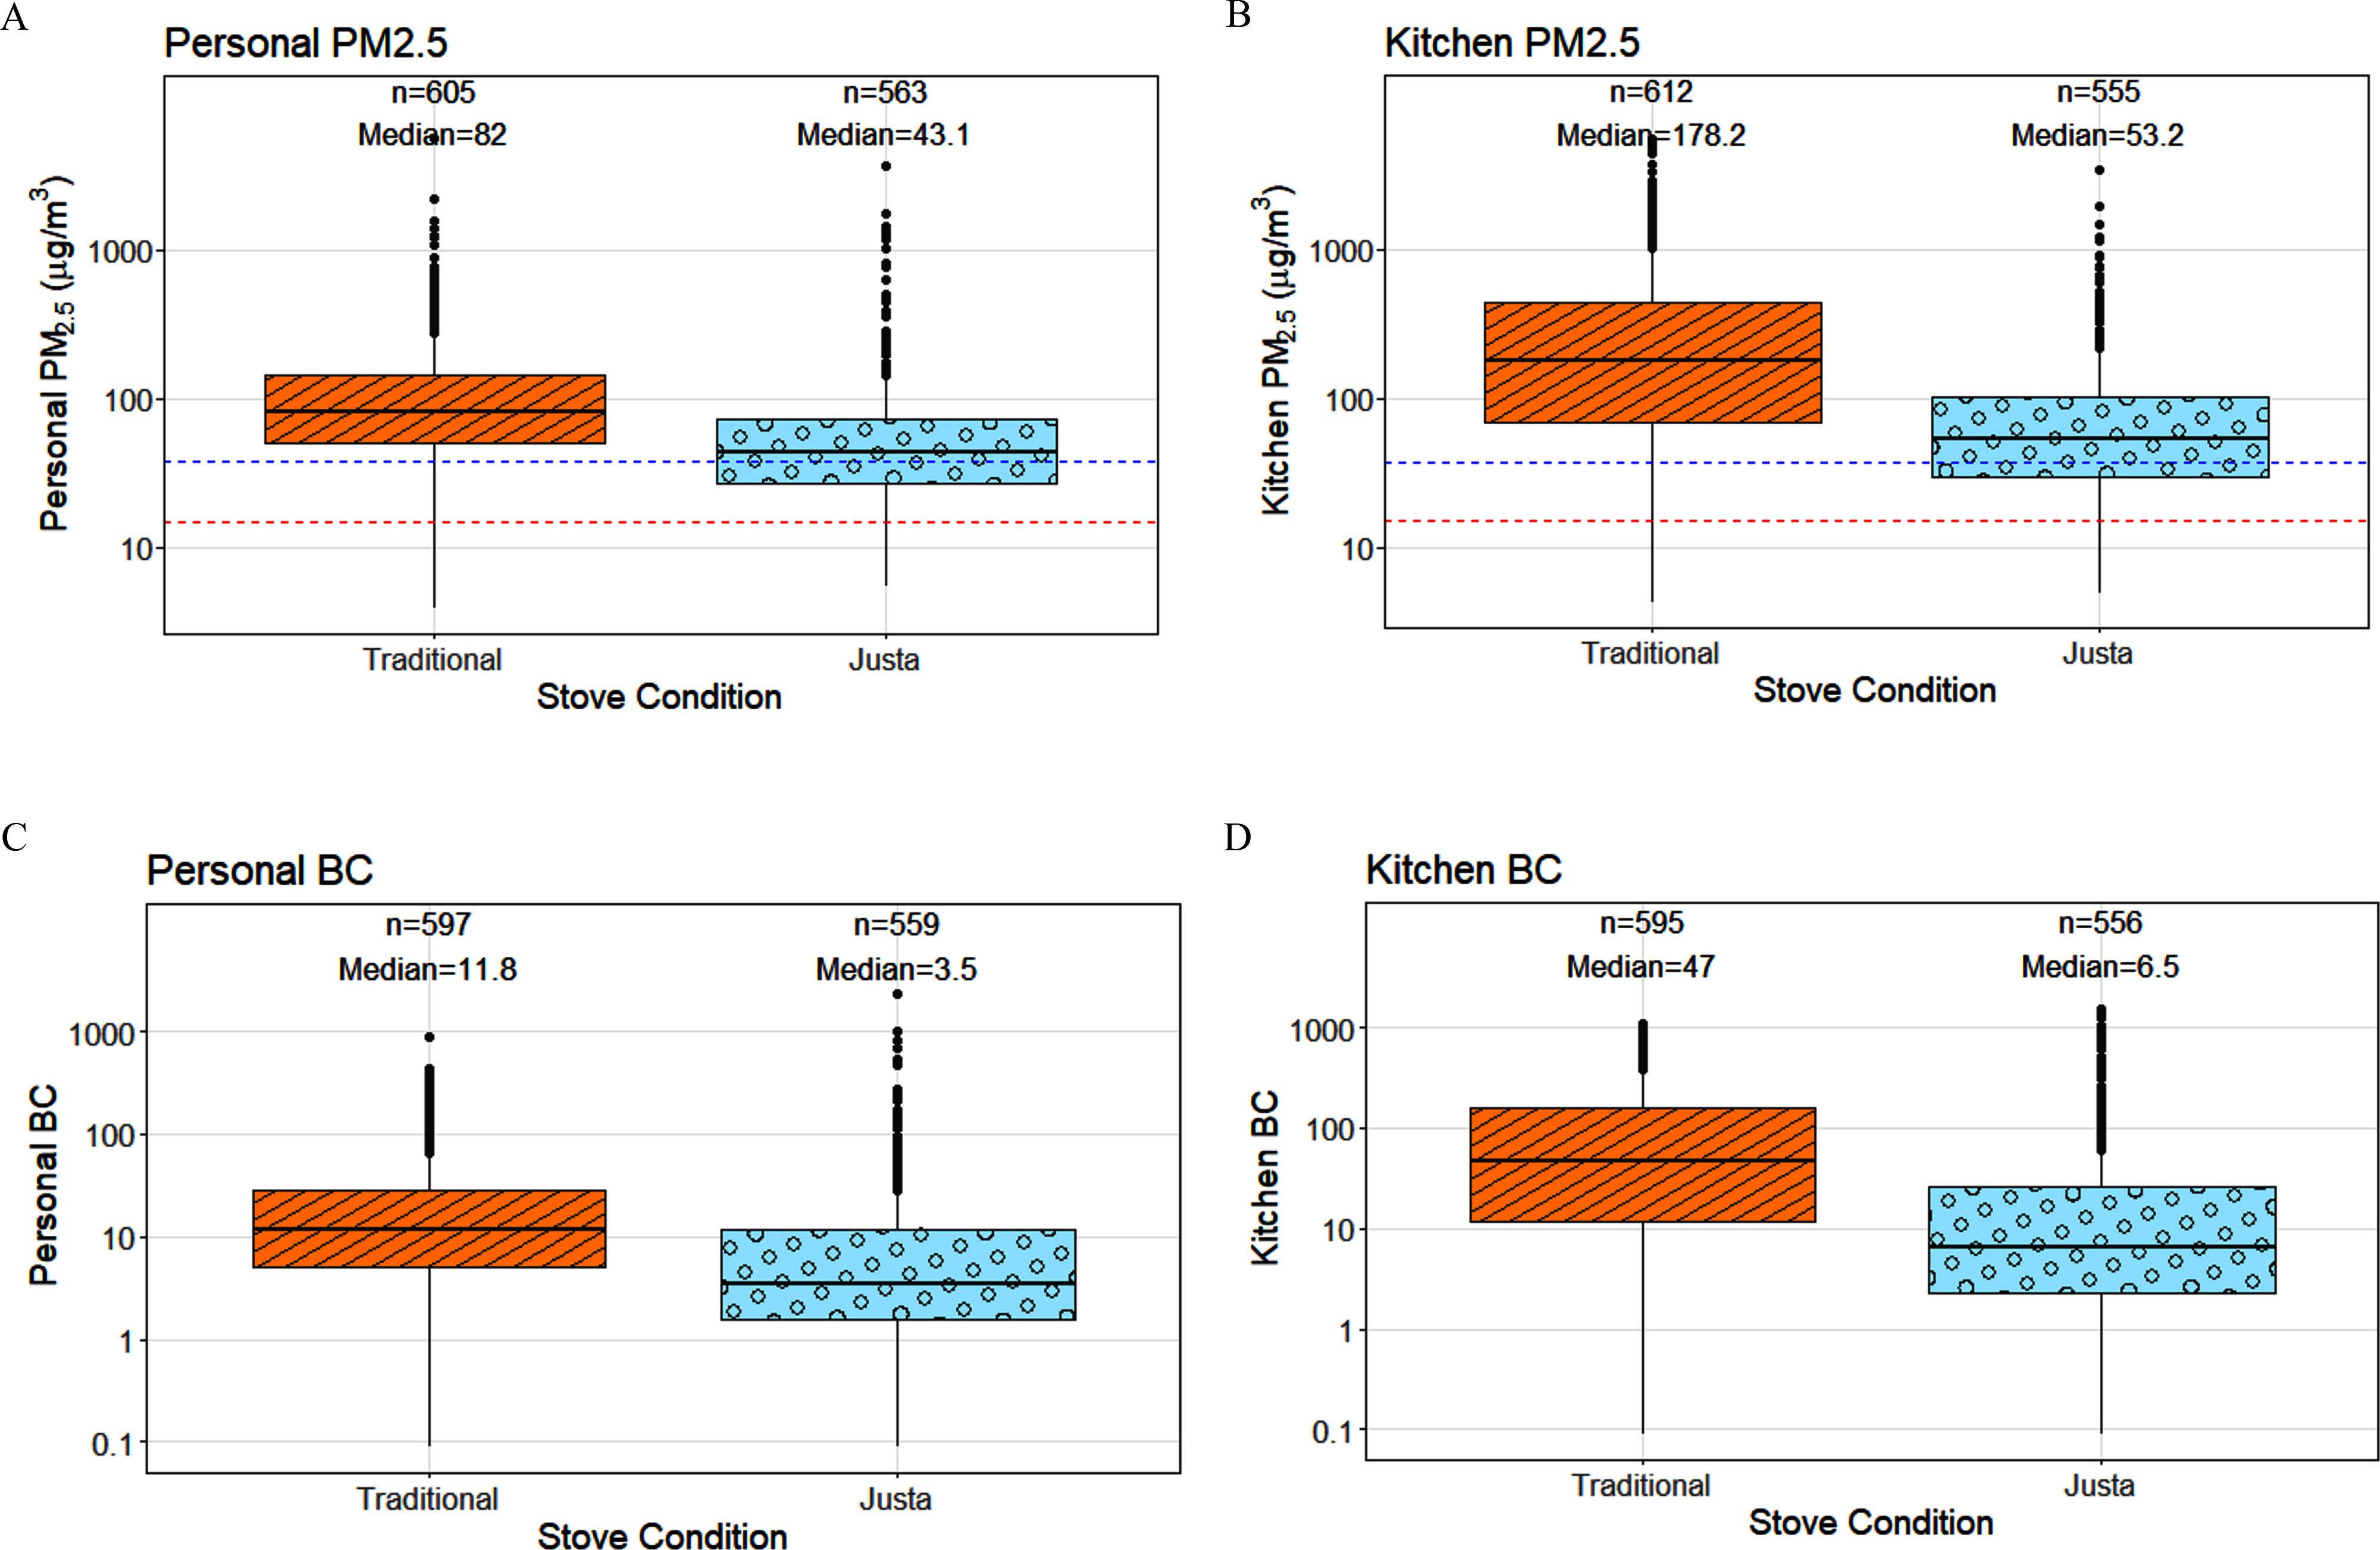
Background: Type 2 diabetes is a rapidly growing global health challenge in low- and middle-income countries (LMICs), and evidence suggests that air pollution exposure contributes. Household air pollution from burning solid fuels for cooking is a major burden in LMICs, but studies demonstrating associations between reductions in household air pollution and improvements in HbA1c, a biomarker of diabetes risk, are lacking. We previously reported substantial reductions in fine particulate matter with an aerodynamic diameter () and black carbon concentrations following an intervention in rural Honduras with the Justa cookstove, a wood-burning stove with an engineered combustion chamber and chimney.
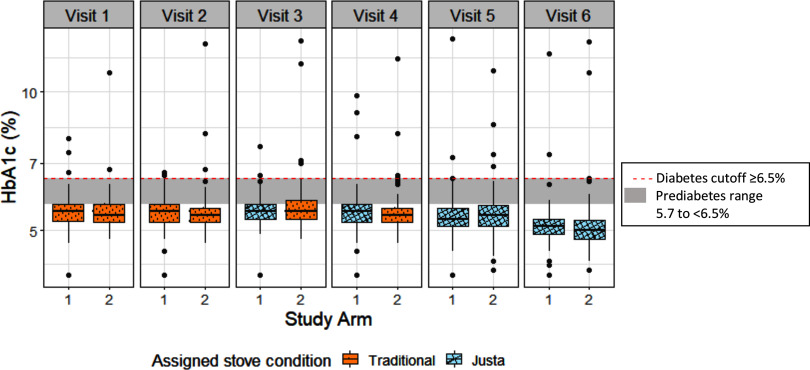
Objective: In a stepped-wedge randomized controlled trial among 230 Honduran women using traditional wood-burning stoves at baseline, we evaluated the effect of the Justa intervention on HbA1c and characterized the longitudinal associations between air pollution exposures and HbA1c.
Methods: At each of six visits over 3 y, we measured 24-h and black carbon concentrations, and finger-stick HbA1c levels. We used linear mixed models in intent-to-treat (condition by assigned stove type), exposure-response (using 24-h measures and modeled estimates of long-term exposures), and "per protocol" self-reported stove use analyses.
Results: HbA1c was reduced for the Justa condition in comparison with the traditional stove condition, but estimates were small and not statistically significant [ percentage points, 95% confidence interval (CI): , 0.07, observations]. A slightly stronger effect was observed when using self-reported stove use in per protocol analyses. Exposure-response analyses demonstrated positive associations between HbA1c and air pollution [e.g., HbA1c was 0.22 percentage points higher (95% CI: 0.13, 0.30) per log-unit higher long-term average personal ].
Discussion: Our study provides novel evidence of exposure-response associations between household air pollution and HbA1c within a randomized cookstove trial, contributing to the evidence base necessary to support clean cooking policy initiatives. https://doi.org/10.1289/EHP15095.
Figures
Similar articles
-
Impact of the wood-burning Justa cookstove on fine particulate matter exposure: A stepped-wedge randomized trial in rural Honduras.Sci Total Environ. 2021 May 1;767:144369. doi: 10.1016/j.scitotenv.2020.144369. Epub 2020 Dec 29. Sci Total Environ. 2021. PMID: 33429278 Free PMC article. Clinical Trial.
-
Study protocol for a stepped-wedge randomized cookstove intervention in rural Honduras: household air pollution and cardiometabolic health.BMC Public Health. 2019 Jul 8;19(1):903. doi: 10.1186/s12889-019-7214-2. BMC Public Health. 2019. PMID: 31286921 Free PMC article.
-
Effectiveness of interventions to reduce household air pollution and/or improve health in homes using solid fuel in low-and-middle income countries: A systematic review and meta-analysis.Environ Int. 2017 Jun;103:73-90. doi: 10.1016/j.envint.2017.03.010. Epub 2017 Mar 22. Environ Int. 2017. PMID: 28341576
-
Real-life effectiveness of 'improved' stoves and clean fuels in reducing PM2.5 and CO: Systematic review and meta-analysis.Environ Int. 2017 Apr;101:7-18. doi: 10.1016/j.envint.2017.01.012. Epub 2017 Jan 28. Environ Int. 2017. PMID: 28285622
-
In-situ measurements of emissions and fuel loading of non-catalytic cordwood stoves in rural Oregon.J Air Waste Manag Assoc. 2025 Jul;75(7):503-521. doi: 10.1080/10962247.2025.2483217. Epub 2025 May 14. J Air Waste Manag Assoc. 2025. PMID: 40146210
References
-
- IHME (Institute for Health Metrics and Evaluation). 2020. GBD Compare Data Visualization. Institute for Health Metrics and Evaluation. http://www.healthdata.org/data-visualization/gbd-compare [accessed 25 October 2020].
-
- Smith KR, Pillarisetti A. 2017. Household air pollution from solid cookfuels and its effects on health. In: Injury Prevention and Environmental Health. 3rd ed. Mock CN, Nugent R, Kobusingye O, Smith KR, eds. Washington, DC: The International Bank for Reconstruction and Development/The World Bank. http://www.ncbi.nlm.nih.gov/books/NBK525225/ [accessed 21 July 2020]. - PubMed
-
- Health Effects Institute (HEI), IHME. 2024. State of Global Air 2024. www.stateofglobalair.org [accessed 23 May 2025].
Publication types
MeSH terms
Substances
Grants and funding
LinkOut - more resources
Full Text Sources
Medical
