. 2025 Apr;15(4):240262.
doi: 10.1098/rsob.240262. Epub 2025 Apr 30.

Insights into the bioluminescence systems of three sea pens (Cnidaria: Anthozoa): from de novo transcriptome analyses to biochemical assays

Affiliations

Insights into the bioluminescence systems of three sea pens (Cnidaria: Anthozoa): from de novo transcriptome analyses to biochemical assays

Laurent Duchatelet et al. Open Biol. 2025 Apr.

Abstract

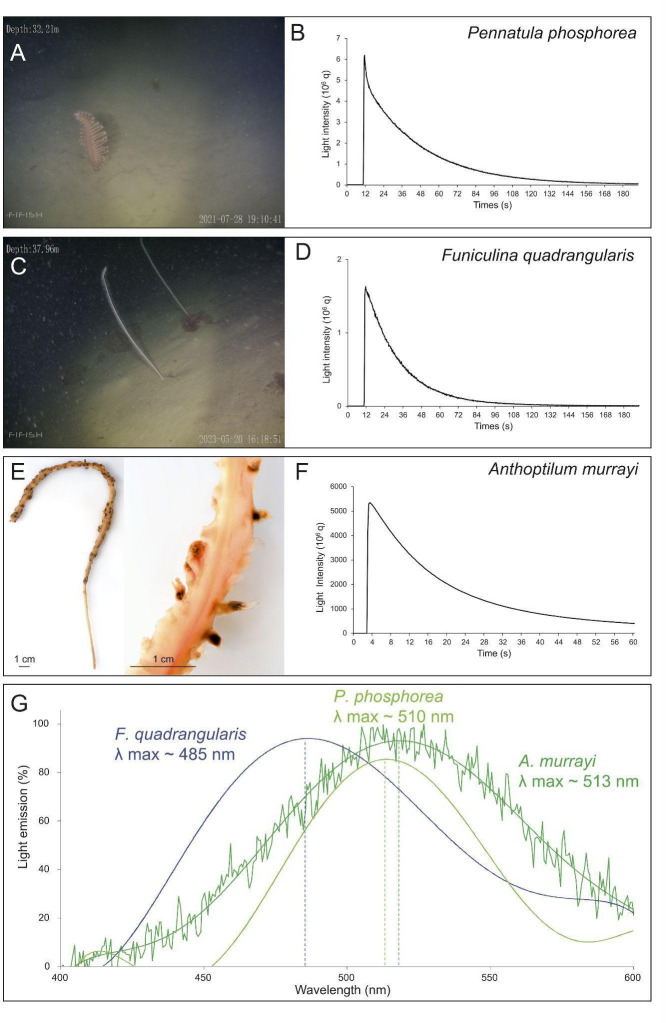
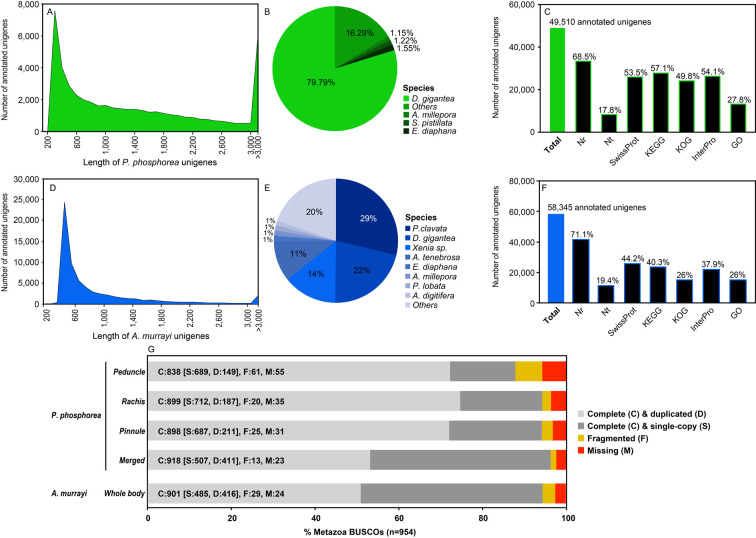
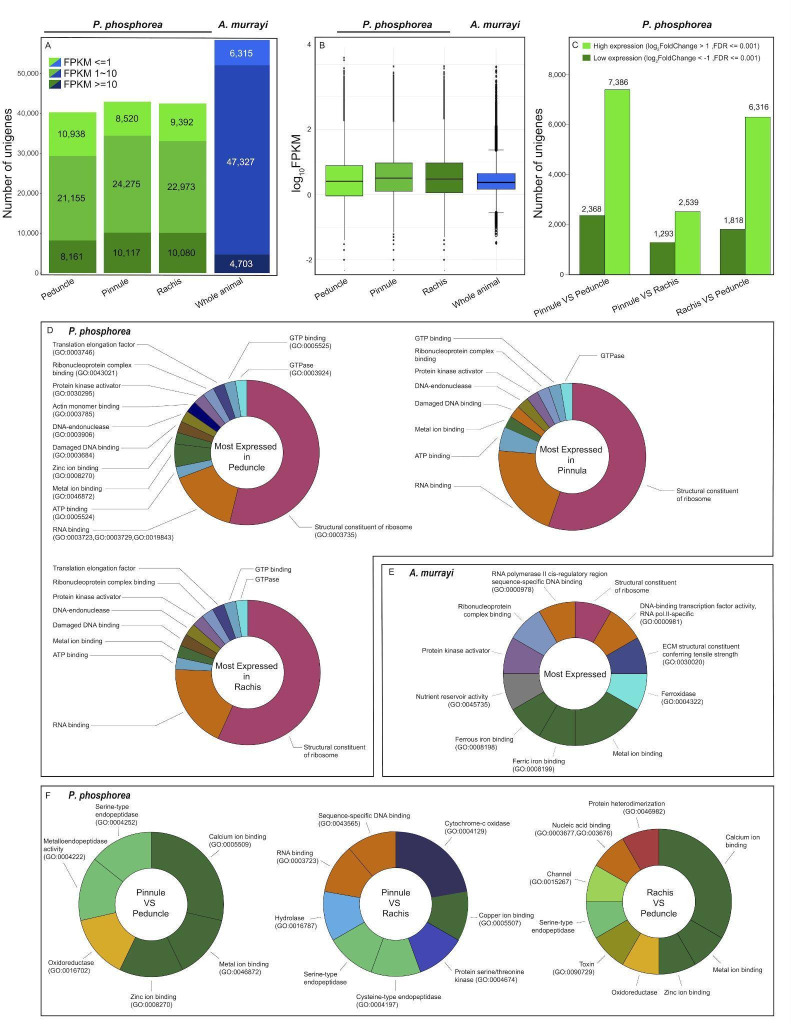
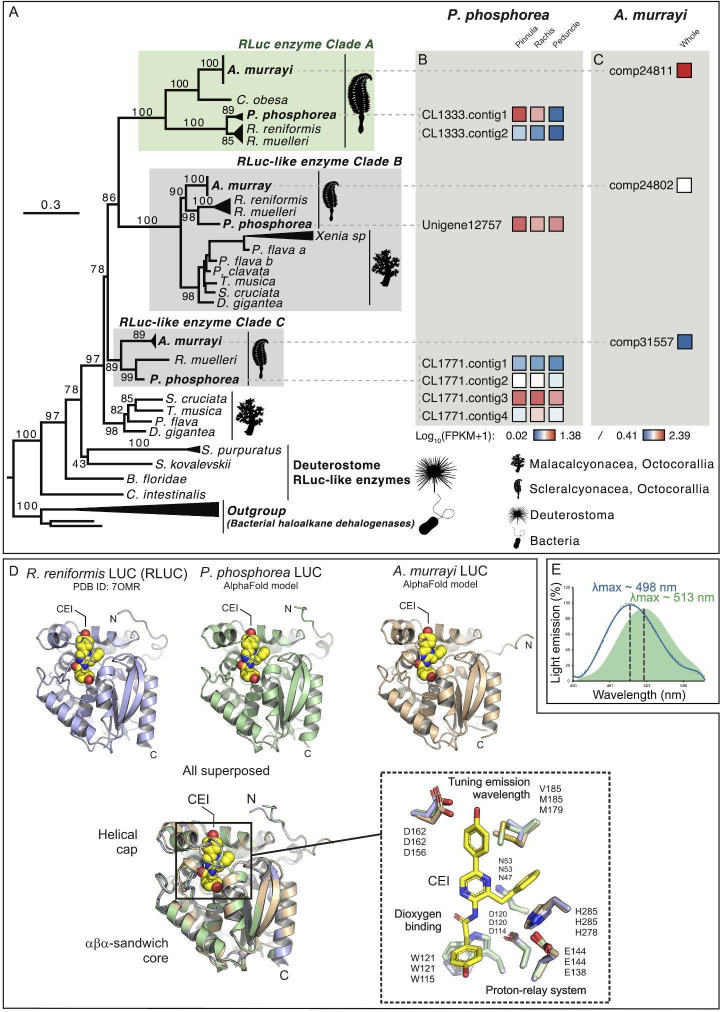
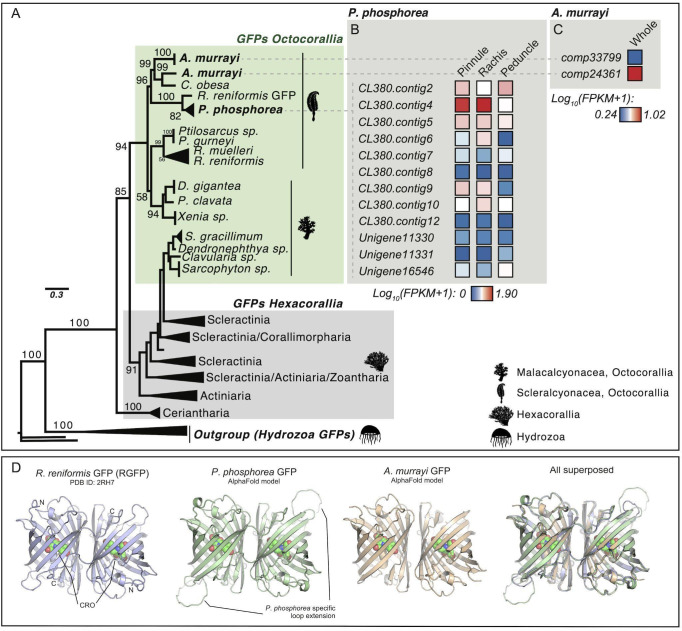
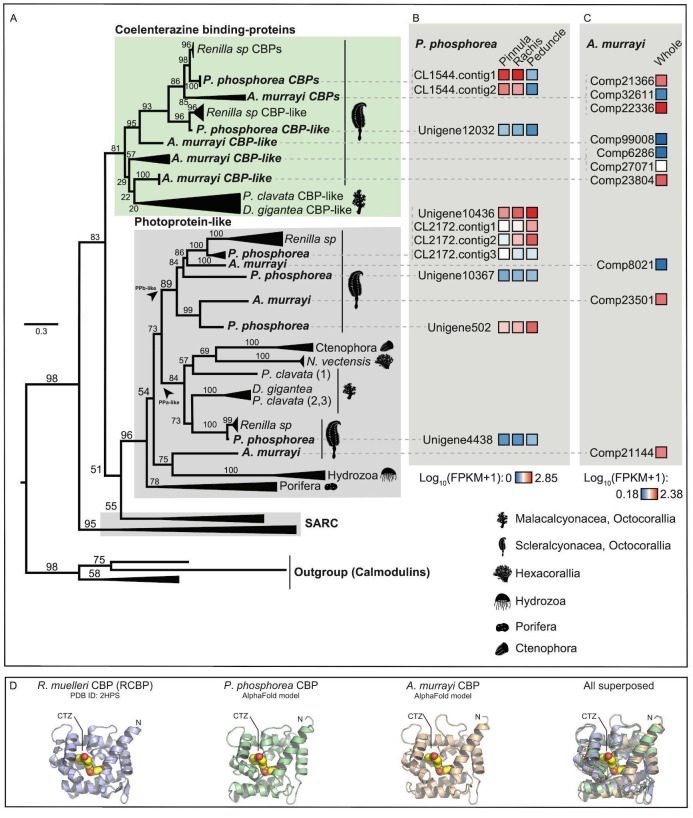
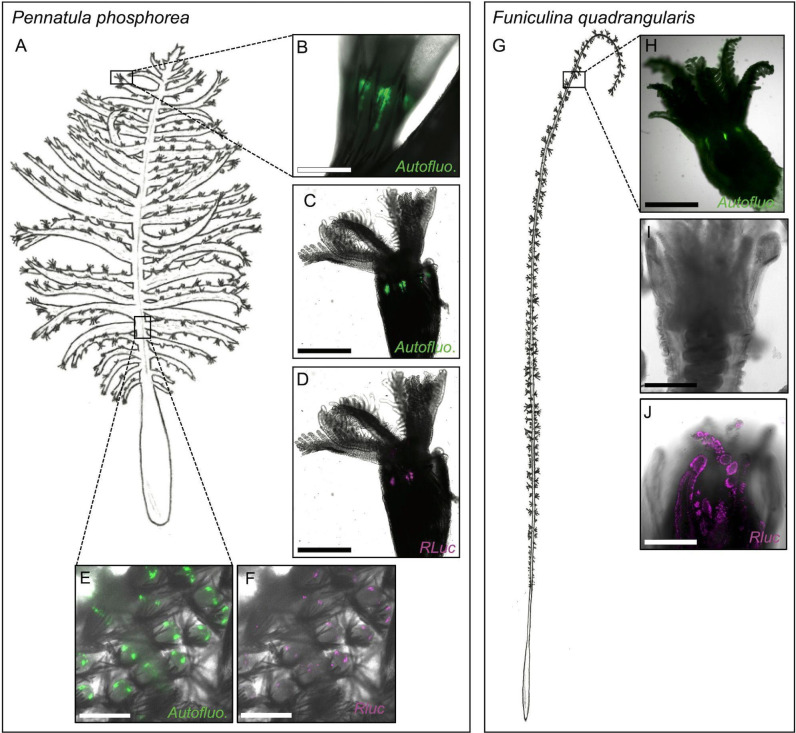
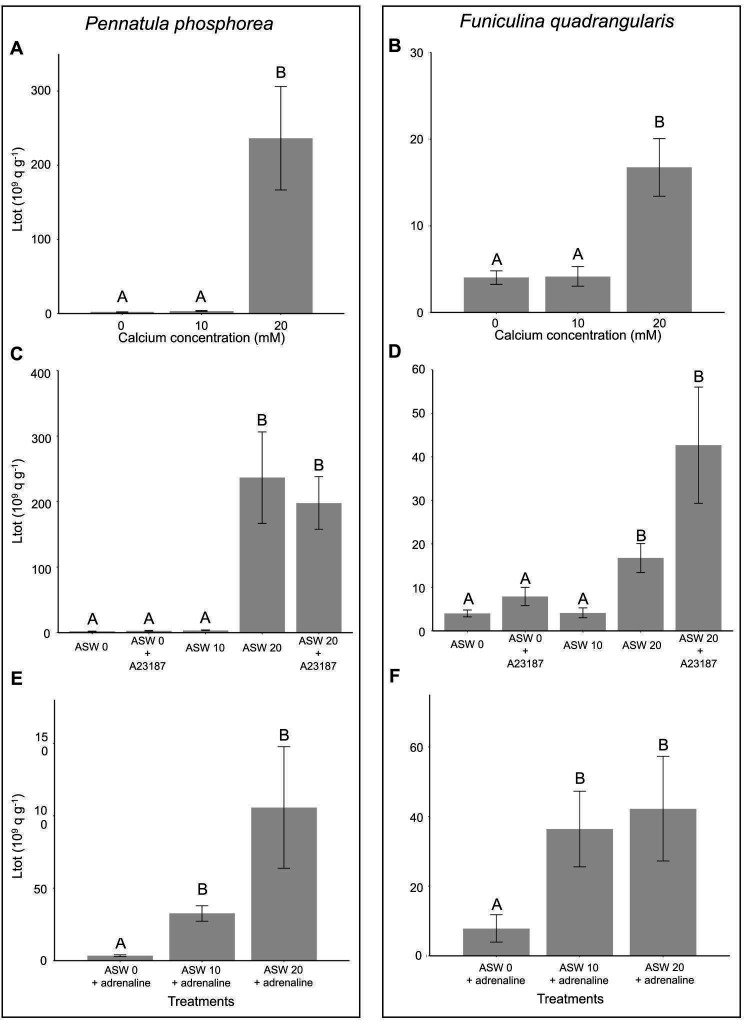
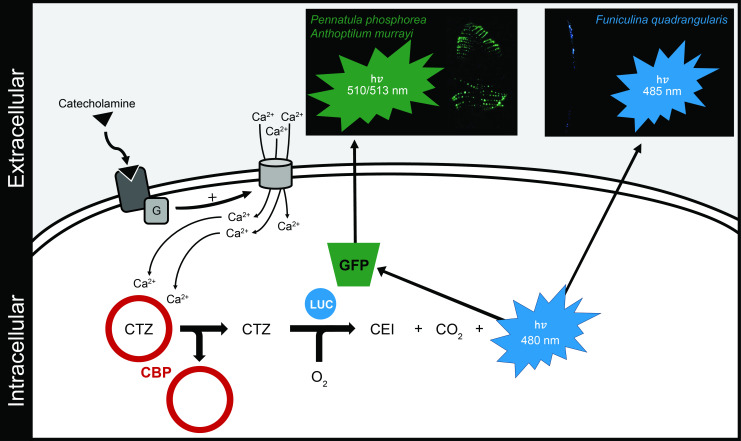
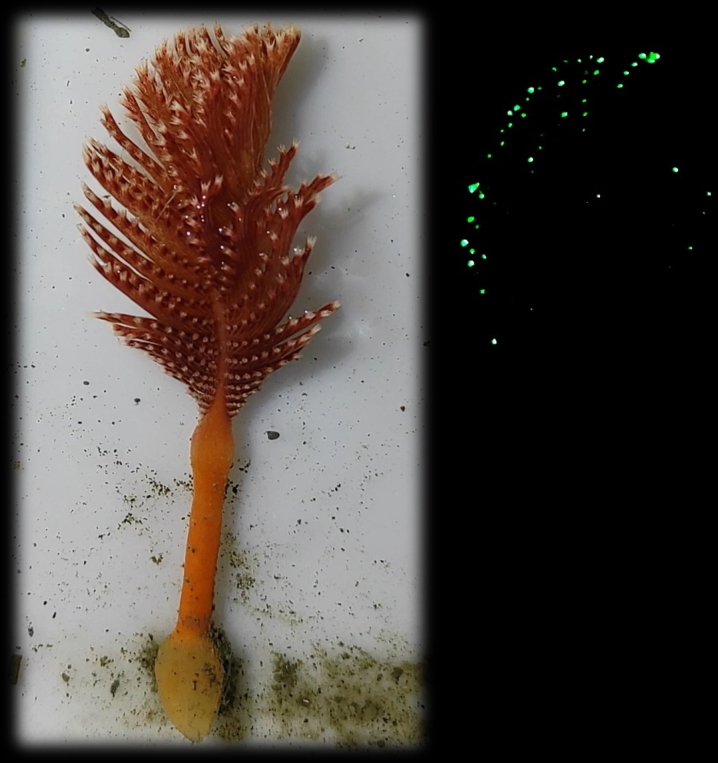
Bioluminescence is the production of visible light by living organisms. It occurs through the oxidation of luciferin substrates catalysed by luciferase enzymes. Auxiliary proteins, such as fluorescent proteins and luciferin-binding proteins, can modify the light emitted wavelength or stabilize reactive luciferin molecules, respectively. Additionally, calcium ions are crucial for the luminescence across various species. Despite the large phylogenetic distribution of bioluminescent organisms, only a few systems have been comprehensively studied. Notably, cnidarian species of the Renilla genus utilize a coelenterazine-dependent luciferase, a calcium-dependent coelenterazine-binding protein and a green fluorescent protein. We investigated the bioluminescence of three sea pen species: Pennatula phosphorea, Anthoptilum murrayi and Funiculina quadrangularis (Pennatuloidea, Anthozoa). Their light-emission spectra reveal peaks at 510, 513 and 485 nm, respectively. A coelenterazine-based reaction was demonstrated in all three species. Using transcriptome analyses, we identified transcripts coding for luciferases, green fluorescent proteins and coelenterazine-binding proteins for P. phosphorea and A. murrayi. Immunodetection confirmed the expression of luciferase in P. phosphorea and F. quadrangularis. We also expressed recombinant luciferase of A. murrayi, confirming its activity. We highlighted the role of calcium ions in bioluminescence, possibly associated with the mechanism of substrate release at the level of coelenterazine-binding proteins. The study proposes a model for anthozoan bioluminescence, offering new avenues for future ecological and functional research on these luminous organisms.

Keywords: Anthoptilidae; Funiculidae; Pennatulidae; bioluminescence; coelenterazine; luciferase; luciferin-binding protein; luminous system.


Conflict of interest statement

We declare we have no competing interests.

Figures

Figure 1.
Figure 1.
Biochemistry assays. (A) In situ images of P. phosphorea and (B) typical CTZ assay curve for the pinnules. (C) In situ images of F. quadrangularis and (D) typical CTZ assay curve for the 3 cm long polyp-bearing rachis. (E) Images of A. murrayi with a zoom on the polyp on the rachis and (F) typical CTZ assay curve for the whole specimen. (G) Anthoptilum murrayi in vivo luminescence spectrum compared with the retrieved spectra of two other species (P. phosphorea [61] and F. quadrangularis [15]). (A,C) Images provided by Fredrik Gröndahl.
General description of the transcriptomic data.
Figure 2.
General description of the transcriptomic data. (A) The length distribution of P. phosphorea unigenes. (B) Taxonomic annotation of the P. phosphorea transcriptome. (C) Global annotation of P. phosphorea transcriptome. (D) Length distribution of the A. murrayi unigenes. (E) Taxonomic annotation of A. murrayi transcriptome. (F) Global annotation of the A. murrayi transcriptome. (G) BUSCO analyses.
Global gene expression and Gene Ontology of P. phosphorea and A. murrayi transcriptomic data.
Figure 3.
Global gene expression and Gene Ontology of P. phosphorea and A. murrayi transcriptomic data. (A) Distribution of FPKM expression values across the P. phosphorea and A. murrayi transcriptomes. (B) Gene expression distribution for each sample. (C) Proportions of unigenes with relatively high or low expression levels in P. phosphorea samples. Gene Ontology distribution of the 40 most highly expressed unigenes for each sample of P. phosphorea (D) and A. murrayi (E). (F) Comparison of Gene Ontology repartition of the 40 most highly expressed unigenes in P. phosphorea samples.
Phylogenetic tree of RLuc-like enzymes, including P. phosphorea and A. murrayi amino acid sequences.
Figure 4.
Phylogenetic tree of RLuc-like enzymes, including P. phosphorea and A. murrayi amino acid sequences. (A) Maximum likelihood tree based on the amino acid sequence alignment of RLuc-like enzymes. The tree was calculated by IQ-tree software using the LG+I+G4 model of evolution. Numbers at the nodes indicate ultrafast bootstrap values based on 1000 replicates. The scale bar represents the percentage of amino acid substitutions per site. Bacterial haloalkane dehalogenase sequences were used to root the tree. (B) The expression level of each retrieved RLuc-like sequence in a distinct portion of P. phosphorea. (C) Expression level of each retrieved RLuc-like sequence in the whole A. murrayi specimen. (D) Structural comparison of AlphaFold models of P. phosphorea and A. murrayi Luc proteins and the crystal structure of R. reniformis Luc complexes with coelenteramide (CEI) oxyluciferin (PDB ID: 7OMR). (E) Superimposed spectrum of the in vivo luminescence of A. murrayi (green) and the in vitro luminescent assay of A. murrayi LUC in the presence of CTZ (fc.: 6 µM; blue).
Phylogenetic tree of anthozoan fluorescent proteins, including P. phosphorea and A. murrayi amino acid sequences.
Figure 5.
Phylogenetic tree of anthozoan fluorescent proteins, including P. phosphorea and A. murrayi amino acid sequences. (A) Maximum likelihood tree based on GFP amino acid sequence alignment. The tree was calculated by IQ-tree software using the WAG + R4 model of evolution. Numbers at the nodes indicate ultrafast bootstrap percentages based on 1000 replicates. The scale bar represents the percentage of amino acid substitutions per site. Hydrozoan GFP sequences were used to root the tree. (B) The expression level of each retrieved GFP sequence for a distinct portion of P. phosphorea. (C) The expression level of each retrieved GFP sequence in the whole A. murrayi specimen. (D) Structural comparison of AlphaFold models of P. phosphorea and A. murrayi GFP proteins and the crystal structure of R. reniformis GFP (PDB ID: 2HR7).
Phylogenetic tree of CBPs, including P. phosphorea and A. murrayi amino acid sequences.
Figure 6.
Phylogenetic tree of CBPs, including P. phosphorea and A. murrayi amino acid sequences. (A) Maximum likelihood tree based on the amino acid sequence alignment of CBPs. The tree was calculated by IQ-tree software using the LG + R4 model of evolution. Numbers at the nodes indicate ultrafast bootstrap percentages based on 1000 replicates. The scale bar represents the percentage of amino acid substitutions per site. Calmodulin sequences were used to root the tree. (B) The expression level of each retrieved CBP and CBP-like sequence for a distinct portion of P. phosphorea. (C) Expression level of each retrieved CBP and CBP-like sequence in the whole A. murrayi specimen. (D) Structural comparison of AlphaFold models of P. phosphorea and A. murrayi CBP proteins and the crystal structure of R. muelleri CBP complexes with CTZ luciferin (PDB ID: 2HPS).
Autofluorescence and LUC immunodetection in P. phosphorea and F. quadrangularis.
Figure 7.
Autofluorescence and LUC immunodetection in P. phosphorea and F. quadrangularis. (A) Schematic illustration of P. phosphorea. Natural green autofluorescence (B), green fluorescence after fixation (C) and LUC immunodetection (D; magenta) of the P. phosphorea pinnule autozooids. Green fluorescence after fixation (E) and LUC immunodetection (F; magenta) in P. phosphorea rachis siphonozooids. (G) Schematic illustration of F. quadrangularis. Natural green autofluorescence (H), observation after fixation with no autofluorescence signal (I) and LUC immunodetection (J; magenta) of the F. quadrangularis autozooids. Scale bars, (B–F,H) 500 μm and (I,J) 250 μm.
Calcium involvement in P. phosphorea and F. quadrangularis light emissions.
Figure 8.
Calcium involvement in P. phosphorea and F. quadrangularis light emissions. Experiments were performed on P. phosphorea (A,C,E) and F. quadrangularis (B,D,F). Effect of different concentrations of calcium (0, 10 and 20 mM) in the medium on the total light emission (Ltot) (A,B). Effect of different calcium concentrations (0, 10 and 20 mM) in the medium in the presence and absence of the calcium ionophore A23187 on the Ltot (C,D). Effect of different concentrations of calcium (0, 10 and 20 mM) in the medium in the presence of adrenaline (10−5 mol l−1) on the Ltot (E,F). Different lettering indicates statistical differences.
Schematic of the putative pathway driving the luminescence production in sea pens.
Figure 9.
Schematic of the putative pathway driving the luminescence production in sea pens. Elements of this pathway have been compiled from the present results and the literature [,,,–,–36]. CBP, coelenterazine-binding protein; CEI, coelenteramide; CTZ, coelenterazine; G, G protein; GFP, green fluorescent protein; LUC, luciferase. The clear colocalization of specific molecular actors (e.g. catecholaminergic receptors, CBP, GFP, LUC) still needs to be established to confirm the following predicted pathway.
None

Similar articles

References

    1. Shimomura O, Yampolsky I. 2019. Bioluminescence: chemical principles and methods, 3rd edn. Singapore: World Scientific Publishing.
    1. Haddock S, Moline M, Case J. 2010. Bioluminescence in the sea. Annu. Rev. Mar. Sci 2, 443–493. (10.1146/annurev-marine-120308-081028) - DOI - PubMed
    1. Delroisse J, Duchatelet L, Flammang P, Mallefet J. 2021. Leaving the dark side? Insights into the evolution of luciferases. Front. Mar. Sci. 8, 673620. (10.3389/fmars.2021.673620) - DOI
    1. Fleiss A, Sarkisyan KS. 2019. A brief review of bioluminescent systems (2019). Curr. Genet. 65, 877–882. (10.1007/s00294-019-00951-5) - DOI - PMC - PubMed
    1. Hastings JW. 1996. Chemistries and colors of bioluminescent reactions: a review. Gene 173, 5–11. (10.1016/0378-1119(95)00676-1) - DOI - PubMed

LinkOut - more resources