. 2025 May;38(3):e70021.
doi: 10.1111/pcmr.70021.

BAP1 Loss Affords Lipotoxicity Resistance in Uveal Melanoma

Affiliations

BAP1 Loss Affords Lipotoxicity Resistance in Uveal Melanoma

C J Cunanan et al. Pigment Cell Melanoma Res. 2025 May.

Abstract

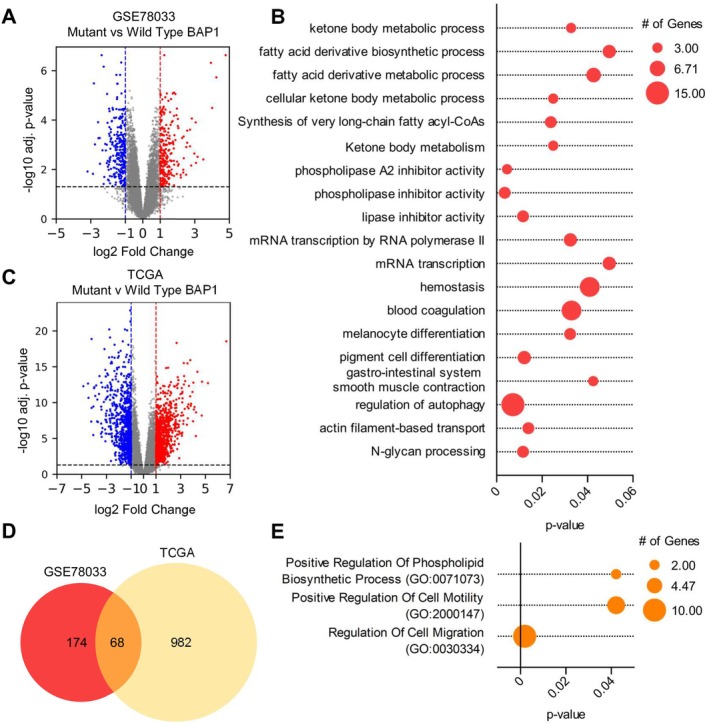
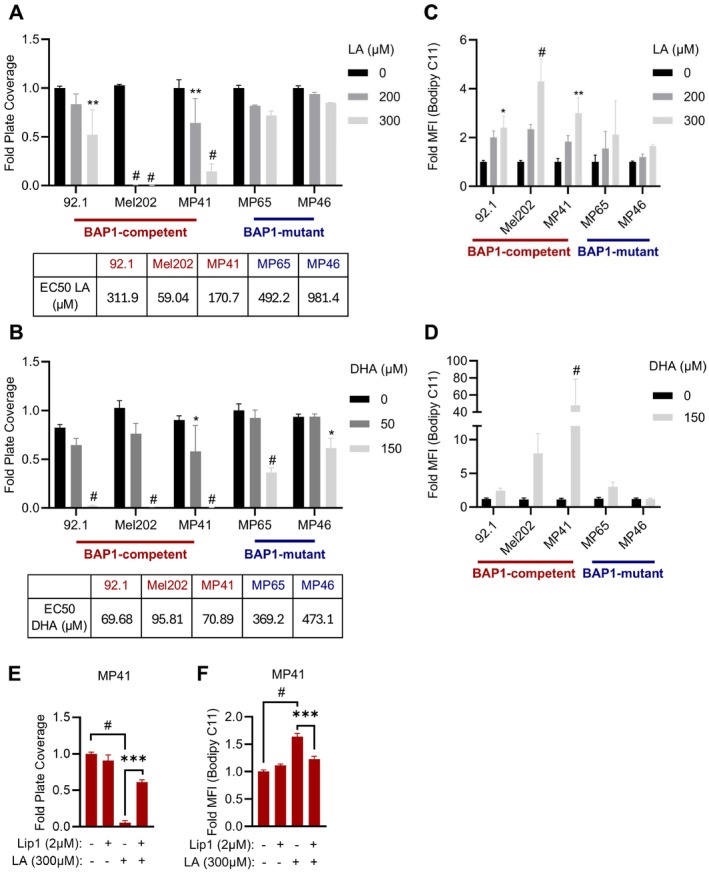
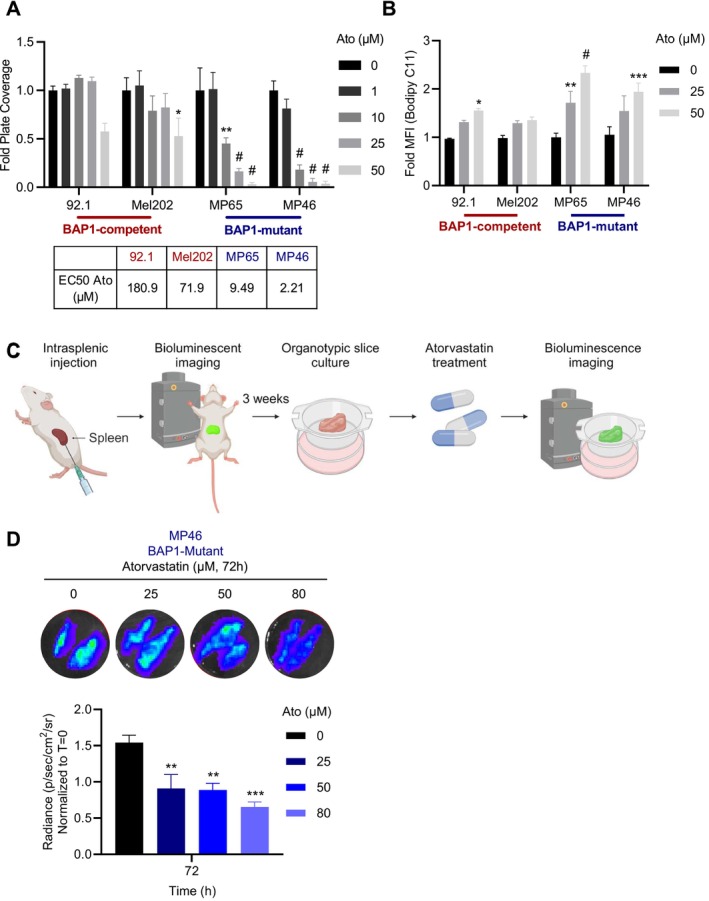
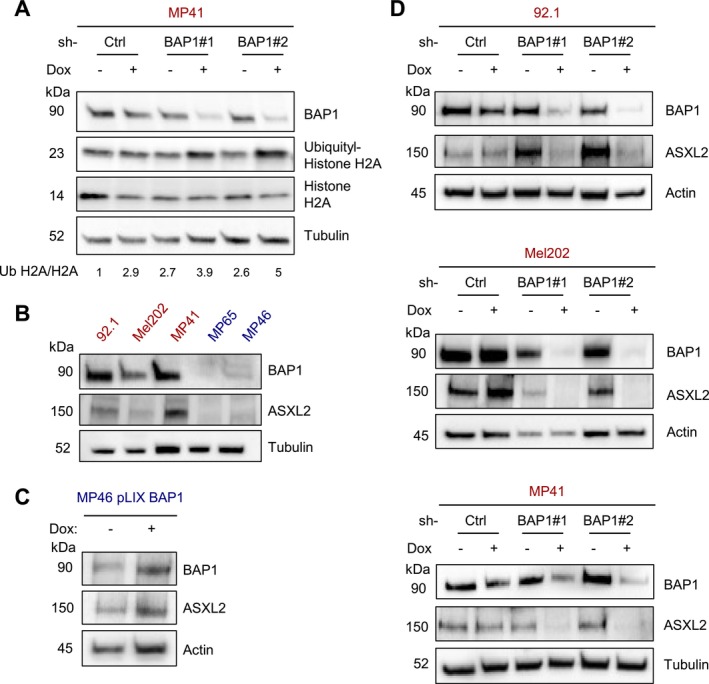
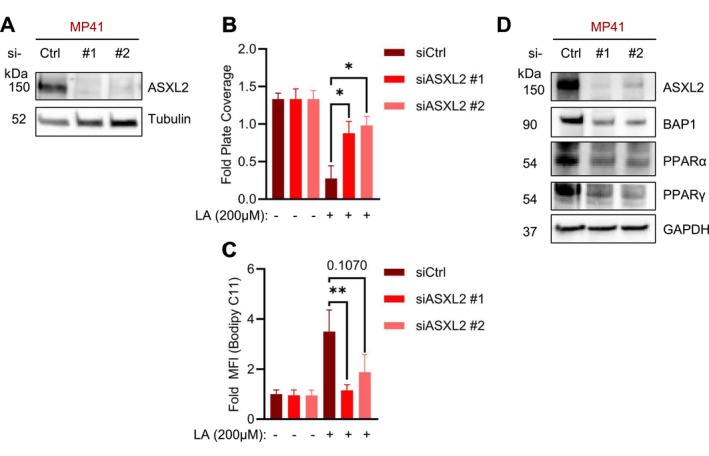
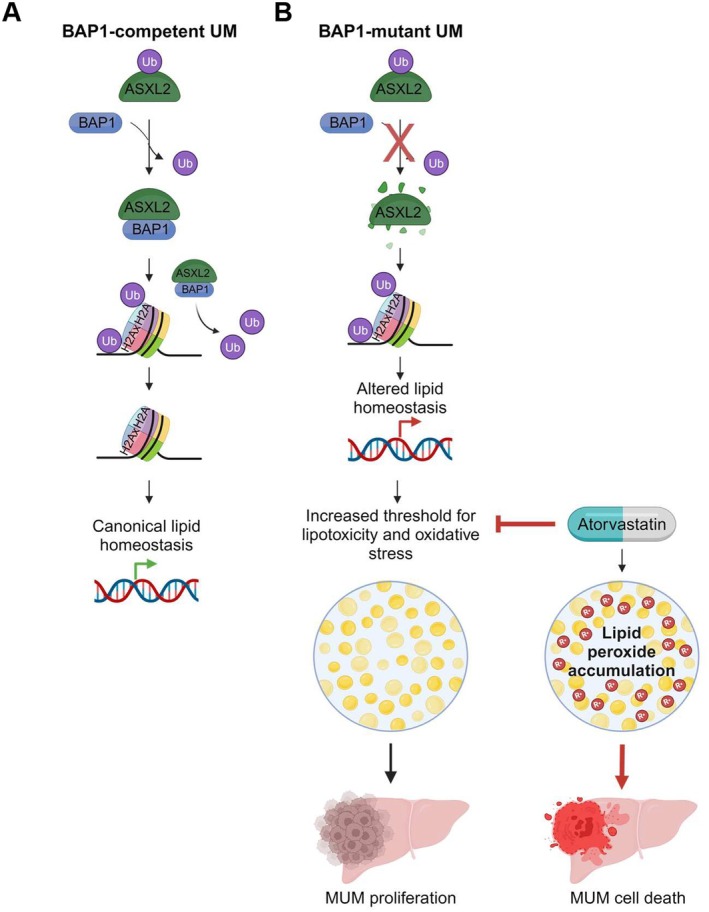
Uveal melanoma (UM) is an aggressive intraocular malignancy. Despite effective control of primary tumors, ~50% of UM patients develop metastases, with the liver being the predominant secondary site. BAP1 deficiency, present in ~80% of metastatic UM cases, is strongly associated with increased metastatic risk and poor prognosis. In silico analysis of UM patient samples suggests that reduced BAP1 is linked to enhanced expression of genes involved in fatty acid processing; therefore, we hypothesize that BAP1 deficiency primes UM cells for survival in the hepatic microenvironment by enhancing lipid tolerance and oxidative stress responses. Our findings demonstrate BAP1-mutant UM resist lipotoxicity, whereas BAP1-competent UM exhibit sensitivity due to lipid peroxide accumulation-a hallmark of ferroptotic-like stress, and a response that can be mitigated by ferroptosis inhibition. Using an ex vivo liver slice model, we found that disrupting lipid metabolism with atorvastatin, an HMG-CoA reductase inhibitor, reduced tumor burden of BAP1-mutant UM. Moreover, we demonstrate a positive correlation between BAP1 and an epigenetic regulator of lipid homeostasis, ASXL2. Notably, ASXL2 depletion in BAP1-competent UM phenocopies the lipotoxicity resistance observed in BAP1-mutant UM-an effect that may be mediated by altered PPAR expression. This study reveals a novel mechanism linking BAP1 expression to lipid sensitivity via ASXL2, providing insights into liver tropism and potential therapeutic avenues for metastatic uveal melanoma.

Keywords: ferroptosis; lipid metabolism; lipids; lipotoxicity; liver; liver microenvironment; metastatic uveal melanoma; uveal melanoma.


Conflict of interest statement

The authors have nothing to report.

Figures

FIGURE 1
FIGURE 1
BAP1‐mutant UM potation exhibits an enhanced fatty acid metabolism signature. (A) Volcano plot analysis of differentially expressed genes comparing BAP1‐mutant versus BAP1‐competent UM patient samples from GSE78033 dataset. Red dots indicate significantly upregulated genes, and blue dots indicate significantly downregulated genes (adjusted p‐value < 0.05, |log2 fold change| > 1). (B) Pathway enrichment analysis of significantly upregulated genes in BAP1‐mutant samples using ClueGO. Circle size corresponds to gene count within each pathway (3.00–15.00 genes), and statistical significance is shown on the x‐axis. (C) Volcano plot analysis of differential gene expression between BAP1‐mutant and BAP1‐competent samples from TCGA uveal melanoma dataset. (D) Venn diagram showing the overlap of significantly upregulated genes between GSE78033 and TCGA datasets, identifying 68 commonly dysregulated genes. (E) Pathway analysis of the 68 shared genes; pathways shown have adjusted p‐value < 0.05. Circle size indicates gene count (2.00–10.00 genes), and statistical significance is shown on the x‐axis.
FIGURE 2
FIGURE 2
BAP1‐mutant UM are more resistant to lipotoxicity and lipid peroxidation. (A, B) Cell proliferation indicated by crystal violet staining and corresponding EC50s of 92.1, Mel202, MP41, MP65, and MP46 cells treated with increasing levels of linoleic acid (LA) (0, 200, and 300 μM—A) or docosahexaenoic acid (DHA) (0, 50, and 150 μM—B). Full dose curves, representative images, and summary tables of significance between BAP1 competent versus mutant cell lines can be found in Figures S2 and S3. (C, D). Lipid peroxidation levels indicated by Bodipy 493/593 C11 staining of 92.1, Mel202, MP41, MP65, and MP46 cells treated with 0, 200, or 300 μM LA for 24 h (C) and 0, 150, or 300 μM DHA for 96 h (D). Summary tables of significance between BAP1 competent versus mutant cell lines can be found in Figure S4. (E, F) Cell proliferation indicated by crystal violet staining (E) and lipid peroxidation levels indicated by Bodipy 493/593 C11 (F) of MP41 cells treated with 2 μM Lip1, 300 μM LA, or both. The quantification of crystal violet staining is represented by fold plate coverage, and Bodipy 493/593 C11 staining by fold MFI compared to vehicle treatment. Results are the averages from at least three independent repeated experiments. The * is indicative of p < 0.05, ** of p < 0.01, *** of p < 0.001, and # p < 0.0001 as determined by two‐way ANOVA analysis with multiple comparisons (A–D) or one‐way ANOVA (E, F).
FIGURE 3
FIGURE 3
BAP1‐mutant UM are sensitive to inhibition of lipid metabolism in vitro and in an ex vivo liver MUM model. (A) Cell proliferation indicated by crystal violet staining and corresponding EC50s of 92.1, Mel202, MP65, and MP46 cells treated with increasing levels of atorvastatin (0, 1, 10, 25, and 50 μM) for 6 days. Full dose curves, representative images, and summary tables of significance between BAP1 competent versus mutant cell lines can be found in Figure S6A–C. (B) Lipid peroxidation levels indicated by Bodipy 493/593 C11 staining of 92.1, Mel202, MP65, and MP46 cells treated with increasing levels of atorvastatin (0, 25, and 50 μM) for 96 h. Summary tables of significance between BAP1 competent versus mutant cell lines can be found in Figure S6D. (C) Schematic representation of the workflow for generating an ex vivo model of BAP1‐mutant liver metastatic uveal melanoma (UM). (D) Representative images depicting BAP1‐mutant (MP46) tumor growth detected by bioluminescence in organotypic liver slices treated with increasing concentrations of atorvastatin (0, 25, 50, and 80 μM) after 72 h. The quantification of tumor burden is represented by fold bioluminescence compared to vehicle treatment at 0 h. Quantification of crystal violet staining is represented by fold plate coverage, and Bodipy 493/593 C11 staining by fold MFI compared to vehicle treatment. Results are the averages from at least three independent repeated experiments, and ex vivo slice experiments are the averages of 3 slices per mouse and n = 3–4 mice per group. The * is indicative of p < 0.05, ** of p < 0.01, *** of p < 0.001, and # p < 0.0001 as determined by one‐way (D) and two‐way ANOVA (A, B) analysis with multiple comparisons.
FIGURE 4
FIGURE 4
BAP1 loss is correlated with increased histone 2A ubiquitination and reduced ASXL2 expression. (A) Western blot of BAP1‐competent (MP41) cells after inducible shRNA‐mediated knockdown of BAP1 probing for BAP1, ubiquityl‐histone H2A, and Histone H2A expression with tubulin as a loading control. The ratio for relative intensity of ubiquityl‐histone H2A over Histone H2A levels is located below. (B) Western blot analysis of BAP1‐competent (92.1, Mel202, MP41) cells and mutant (MP65 and MP46) cells probing for BAP1 and ASXL2 expression at baseline with tubulin as a loading control. (C) Western blot analysis after inducible re‐expression of BAP1 in BAP1‐mutant (MP46) probing for ASXL2 and BAP1 with actin as a loading control. (D) Western blot analysis probing for ASXL2 expression upon inducible knockdown of BAP1 in BAP1‐competent (92.1, Mel202, and MP41) cells with actin and tubulin as loading controls. Western blots are representative of at least three independent repeated experiments.
FIGURE 5
FIGURE 5
Altered lipid metabolism is due to the disruption of BAP1/ASXL2 in BAP1‐mutant UM. (A) Western blot of BAP1‐competent (MP41) cells after siRNA‐mediated knockdown of ASXL2 probing for ASXL2 with tubulin as a loading control. (B) Crystal violet quantification of BAP1‐competent (MP41) cells after siRNA knockdown of ASXL2 and incubation for 6 days treated with increasing levels of LA (0 and 200 μM). The quantification of crystal violet staining is represented by fold plate coverage compared to vehicle treatment. Representative crystal violet images can be found in Figure S8. (C) Lipid peroxidation levels indicated by Bodipy 493/593 C11 staining of MP41 cells treated following siRNA‐mediated knockdown of ASXL2 with and without treatment with 200 μM LA for 24 h. (D) Western blot of BAP1‐competent (MP41) cells after siRNA‐mediated knockdown of ASXL2 probing for ASXL2, BAP1, PPARα, PPARγ with GAPDH as a loading control. Western blots are representative images, and results are the averages from at least three independent repeated experiments. The * is indicative of p < 0.05, ** of p < 0.01, and # p < 0.0001 as determined by one‐way ANOVA analysis with multiple comparisons (B).
FIGURE 6
FIGURE 6
BAP1/ASXL2 complex loss promotes lipotoxicity resistance in BAP1‐mutant uveal melanoma. (A, B) Schematic representation of the BAP1/ASXL2 axis in UM. (A) In BAP1‐competent cells, BAP1 deubiquitinates and stabilizes ASXL2. The resulting BAP1/ASXL2 complex deubiquitinates Histone H2A, enabling canonical regulation of lipid homeostasis through proper gene expression. (B) In BAP1‐mutant cells, the absence of BAP1‐mediated stabilization leads to ASXL2 degradation. This disruption alters histone modification patterns and subsequent gene expression, resulting in dysregulated lipid homeostasis. The metabolic adaptation increases the threshold for lipotoxicity and oxidative stress, thereby facilitating proliferation in the lipid‐rich liver microenvironment. Importantly, atorvastatin treatment targets this metabolic vulnerability by inhibiting HMG‐CoA reductase, inducing lipid peroxide accumulation and selective MUM cell death, providing a potential therapeutic strategy for BAP1‐mutant liver metastases.

Similar articles

References

    1. Alves‐Bezerra, M. , and Cohen D. E.. 2017. “Triglyceride Metabolism in the Liver.” Comprehensive Physiology 8: 1–8. - PMC - PubMed
    1. Ameer, F. , Scandiuzzi L., Hasnain S., Kalbacher H., and Zaidi N.. 2014. “De Novo Lipogenesis in Health and Disease.” Metabolism 63: 895–902. - PubMed
    1. Baqai, U. , Purwin T. J., Bechtel N., et al. 2022. “Multi‐Omics Profiling Shows BAP1 Loss Is Associated With Upregulated Cell Adhesion Molecules in Uveal Melanoma.” Molecular Cancer Research 20: 1260–1271. - PMC - PubMed
    1. Bindea, G. , Mlecnik B., Hackl H., et al. 2009. “ClueGO: A Cytoscape Plug‐In to Decipher Functionally Grouped Gene Ontology and Pathway Annotation Networks.” Bioinformatics 25: 1091–1093. - PMC - PubMed
    1. Carbone, M. , Yang H., Pass H. I., Krausz T., Testa J. R., and Gaudino G.. 2013. “BAP1 and Cancer.” Nature Reviews. Cancer 13: 153–159. - PMC - PubMed

MeSH terms