. 2025 Apr 29;13(4):e010673.
doi: 10.1136/jitc-2024-010673.

Immunopeptidomics identified antigens for mRNA-lipid nanoparticle vaccines with alpha-galactosylceramide in multiple myeloma therapy

Affiliations

Immunopeptidomics identified antigens for mRNA-lipid nanoparticle vaccines with alpha-galactosylceramide in multiple myeloma therapy

Arne Van der Vreken et al. J Immunother Cancer. .

Abstract

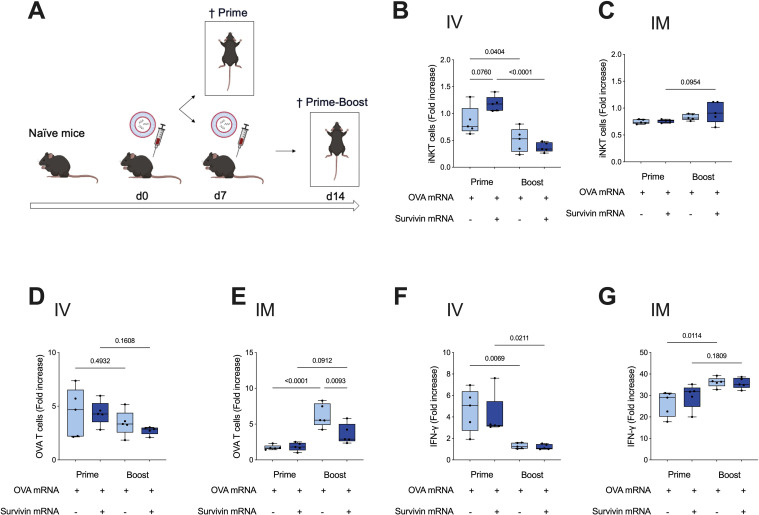
Background: Invariant natural killer T (iNKT) cells and CD8+ T cells are key in the immune response against multiple myeloma (MM), a largely incurable blood cancer. Immunization is a promising strategy to activate these T cell populations. To our knowledge, immunization with messenger RNA (mRNA) and the iNKT agonist, α-galactosylceramide (αGC), has not been studied in MM, as knowledge on clinically relevant antigens in preclinical MM models is lacking.

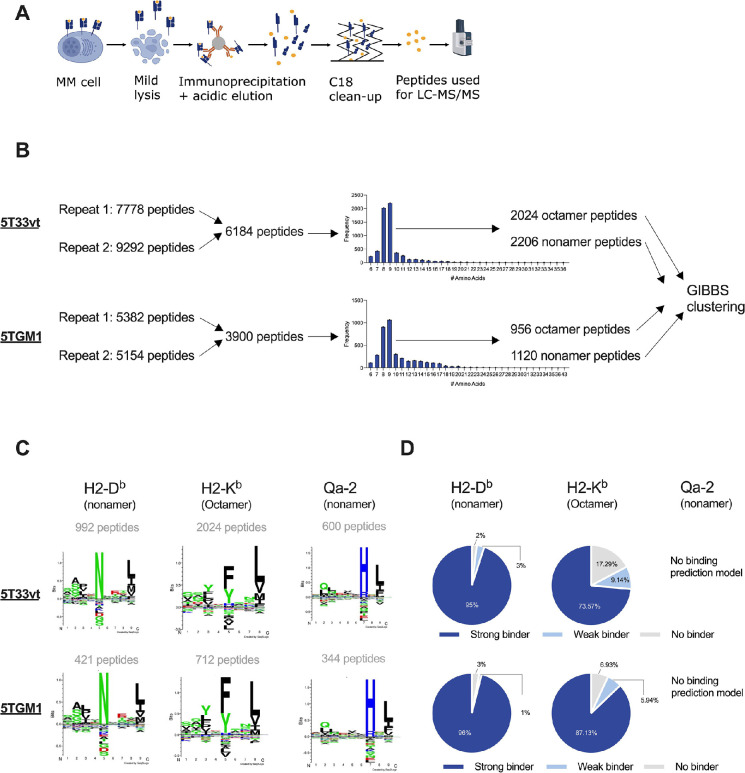
Methods: Microarray data and immunopeptidomics (imPep) were used to identify candidate antigens for immunization in 5TMM models. Galsomes, lipid nanoparticles containing antigen mRNA and αGC were used to immunize 5T33MM-bearing mice. This treatment was combined with a CD40 agonist. Tumor burden and activation of iNKT cells and CD8+ T cells were studied using M-protein electrophoresis, flow cytometry and ELISA.

Results: RNA transcripts revealed survivin as a candidate antigen. Prime-boost Galsomes therapy targeting survivin significantly reduced M-protein levels despite low survivin-specific T cell responses. Further analysis showed potential T cell fratricide. ImPep revealed HSP60, Idiotype, PICALM and EF1A1 as candidate antigens. Prime-boost therapy with Galsomes targeting these antigens reduced MM growth significantly when combined with a CD40 agonist, coinciding with significantly improved antigen presentation, costimulation and cytotoxicity of iNKT cells and CD8+ T cells.

Conclusion: These findings highlight the potential of Galsomes, an mRNA vaccine designed to activate CD8+ T cells and iNKT cells, for MM therapy, and emphasize the importance of combinatorial approaches, addressing immune anergy for effective MM immunotherapies.

Keywords: Immunotherapy; Major histocompatibility complex - MHC; Multiple Myeloma; Nanoparticle; Vaccine.


Conflict of interest statement

Competing interests: The authors declare the following competing interest: therapeutic nanoparticles and methods of use thereof is the topic of a patent (WO2020058239A1) on which IL an RV are inventors. None of the authors receive any support or remuneration related to this platform.

Figures

Figure 1
Figure 1. Survivin is a target antigen in 5T33MM cells with clinical relevance. (A) Log2 values of transcript levels found in four 5T33MM-bearing mice. (B) Scatter plot showing BIRC5 (survivin) expression in BM plasma cells of healthy donors (BMPC) and donors diagnosed with MGUS, smoldering MM (SMM) or MM in the TT2 cohort. Data are log transformed, MAS5-normalized Affymetrix signals with each data point representing one donor (n=12–345). Statistical significance was determined by one-way ANOVA (Tukey post hoc); two-sided p values are reported. (C) Kaplan-Meier curves for patients with MM with low (blue, n=279) or high (red, n=66) expression of BIRC5 (survivin, probe 20,095) in the TT2 cohort. MaxStat analysis was used to calculate the optimal separation of patients based on a cut-off value. The log-rank (Mantel-Cox) test was used to analyze survival curves (n=345). ANOVA, analysis of variance; BM, bone marrow; MGUS, monoclonal gammopathy of unknown significance; MM, multiple myeloma; TT2, Total Therapy 2.
Figure 2
Figure 2. Vaccination with Galsomes containing survivin mRNA impacts MM progression. (A) Schematic representation of the experimental set-up. C57BL/KalwRij mice were inoculated with 5T33MM containing BM cells on day 0. An intravenous injection of Galsomes (+, blue) or PBS (−, gray) was performed on day 3 (prime). On day 10, four mice were sacrificed, while six mice received a second intravenous injection of Galsomes or PBS (prime-boost). Prime-boost vaccinated mice were sacrificed on day 21 when the first mouse in the experiment reached humane endpoints. (B) Box plot graphs showing serum IFN-γ levels as determined 5 hours after prime or boost vaccination (top) or showing the percentage of iNKT cells within splenocytes isolated on day 10 (prime) or 21 (prime-boost) (bottom). (C) Box plot graphs showing IFN-γ production by CD8+ splenocytes as determined 24 hours after survivin-specific (top) or non-specific (anti-CD3/CD28) (bottom) stimulation after prime (left) or boost (right) vaccination. (D) Box plot showing the percentage of survivin-specific CD8+ T cells within splenocytes isolated on day 21 (prime-boost). (E) Box plot showing M-protein levels in serum that was collected on day 21 (prime-boost). (F) Correlation between survivin-specific T cells and disease load (M-protein). Spearman’s rank correlation coefficient (R) and the 95% CI (dashed lines) are shown. In B–E, the gray and blue box plots show the results of mice treated with PBS and Galsomes respectively (n=4 for prime, n=6 for prime-boost). (G) Box plot showing M-protein levels in serum that was collected on day 21 (prime-boost) of mice vaccinated with PBS, LNPs encapsulating survivin mRNA, Galsomes with moIi80tOVA mRNA and Galsomes with survivin mRNA (n=4/group). The horizontal line shows the mean, while each dot represents one data point or mouse. Statistical significance was determined using the Mann-Whitney U test and for (G) the Kruskal-Wallis test. Two-sided p values are shown. α-GalCer, α-galactosylceramide; BM, bone marrow; DC, dendritic cell; IFN-γ, interferon-gamma; iNKT, invariant natural killer T cell; LNPs, lipid nanoparticles; MM, multiple myeloma; mRNA, messenger RNA; PBS, phosphate-buffered saline.
Figure 3
Figure 3. The Galsome vaccination route and use of survivin mRNA impacts CD8+ T cell responses. (A) Schematic representation of the experimental set-up. C57BL/6 mice were vaccinated intravenously or intramuscularly with Galsomes containing moIi80tOVA and tNGFR mRNA (OVA, light blue) or with moIi80tOVA and survivin mRNA (Survivin, dark blue). On day 7, five mice were sacrificed for analysis (prime), while the five remaining mice received a second vaccine (prime-boost). The prime-boost vaccinated mice were sacrificed on day 14. Results were normalized to the corresponding PBS group. (B–C) Box plot graphs showing the relative number of iNKT cells within splenocytes isolated on day 7 (prime) or 14 (prime-boost) from mice receiving an intravenous (B) or intramuscular (C) injection with Galsomes containing the indicated mRNA. (D–E) Box plot graphs showing the relative number of ovalbumin-specific CD8+ T cells within splenocytes isolated on day 7 (prime) or 14 (prime-boost) from mice receiving an intravenous (D) or intramuscular (E) injection with Galsomes containing the indicated mRNA. (F–G) Box plot graphs showing IFN-γ production by CD8+ splenocytes as determined 24 hours following ovalbumin-specific restimulation after intravenous (F) or intramuscular (G) prime or prime-boost vaccination with Galsomes containing the indicated mRNA. In B–G, the light and dark blue box plots show the results of mice treated with moIi80tOVA and tNGFR (OVA) mRNA or with moIi80tOVA and survivin (Survivin) mRNA containing Galsomes respectively. The horizontal line shows the mean, while each dot represents one data point or mouse (n=5 for prime, n=5 for prime-boost). Statistical significance was determined using the one-way ANOVA test (Tukey post hoc); two-sided p values are reported. ANOVA, analysis of variance; iNKT, invariant natural killer T cell; mRNA, messenger RNA; OVA, ovalbumin; PBS, phosphate-buffered saline.
Figure 4
Figure 4. Identification of MHC-I restricted immunopeptides in two related 5T models. (A) Schematic representation of the experimental set-up. 5T33MMvt and 5TGM1 cells were expanded and lysed. Lysates were incubated with an MHC-I specific antibody for immunoprecipitation of MHC-I/peptide complexes. Peptides were retrieved using acidic elution and analyzed by LC-MS/MS. (B) MS2 spectra were searched by PEAKS Studio (V.11 build 20220327) against a database containing all murine sequences listed in UniProt. Peptides identified in both 5T33MMvt and 5TGM1 cells were plotted for length. Octamer and nonamer peptides were submitted for GIBBS clustering analysis. (C) Experimental sequence logos for H2-Db, H2-Kb and Qa-2. (D) Binding prediction using NetMHCpan for the different alleles and octamer and nonamer immunopeptides for both cell lines. MHC-I, major histocompatibility class I; MM, multiple myeloma; MS, mass spectrometry.
Figure 5
Figure 5. Selection of MHC-I restricted immunopeptides in related 5TMM models. (A) Peptides identified in both 5T33MMvt and 5TGM1 cells were selected for analysis. (B) Distribution showing the prevalence of octamer and nonamer peptides presented in MHC-I. (C) Various cellular proteins present more than one peptide. (D) Nonamer peptides were submitted to the online IEDB tool to predict immunogenicity. (E–F) Expression of EF1A1, PICALM and HSP60 in patients with MM of the TT2 cohort. (E) The scatter plots show PICALM (left), EF1A1 (middle) and HSP60 (right) expression in BMPC of healthy donors and donors diagnosed with MGUS, SMM or MM. MaxStat analysis was used to calculate the optimal separation of patients based on a cut-off value. Data are log transformed, MAS5-normalized Affymetrix signals with each data point representing one donor (n=12–345). Respective probes: 212,506, 204,892, 200,807. Statistical significance was determined by one-way ANOVA (Tukey post hoc); two-sided p values are reported. (F) Kaplan-Meier curves for patients with MM with low (blue) or high (red) expression levels of PICALM (left), EF1A1 (middle) and HSP60 (right). The log-rank (Mantel-Cox) test was used to analyze survival curves (n=345). ANOVA, analysis of variance; BMPC, bone marrow plasma cells; IEDB, Immune Epitope Database; MGUS, monoclonal gammopathy of unknown significance; MHC-I, major histocompatibility class I; MM, multiple myeloma; OS, overall survival; SMM, smoldering MM; TT2, Total Therapy 2.
Figure 6
Figure 6. Intramuscular vaccination with Galsomes containing imPep mRNA combined with agonist CD40 therapy reduces MM burden and impacts immune activation. (A) Schematic representation of the experimental set-up. C57BL/KalwRij mice were inoculated with 5T33MM or 5TGM1 cells on day 0. Mice were randomly assigned to one of four groups. On the indicated days, mice in groups 1, 2 and 4 received an intramuscular injection with PBS (group 1) or imPep mRNA containing Galsomes (prime-boost regimen, groups 2 and 4). Mice assigned to groups 3 or 4, received an IP injection with a CD40 agonist (αCD40). Mice were sacrificed when the first mouse reached humane endpoints. Data of groups 2, 3 and 4 were normalized to PBS. (B) Box plot showing the M-protein serum levels of mice treated with imPep mRNA Galsomes, αCD40 or the combination thereof relative to PBS. (C) Representative plots of degranulation marker CD107a and PD-1 expression on CD8+ T cells (left) and box plot graphs showing the relative values (right). (D) Representative plots of degranulation marker CD107a and PD-1 expression on iNKT cells (left) and box plot graphs showing the relative values (right). The light blue, gray and dark blue box plots show the results of mice treated with imPep mRNA Galsomes, αCD40 or the combination thereof respectively. The horizontal line shows the mean, while each dot represents one data point or mouse (n=9 5T33 MM, n=8 5TGM1). Statistical significance was determined using the one-way ANOVA test (Tukey post hoc); two-sided p values are reported. ANOVA, analysis of variance; imPep, immunopeptidomics; iNKT, invariant natural killer T cell; IP, intraperitoneal; MM, multiple myeloma; mRNA, messenger RNA; PBS, phosphate-buffered saline; PD-1, programmed death-1.

References

    1. Oudaert I, Van der Vreken A, Maes A, et al. Metabolic cross-talk within the bone marrow milieu: focus on multiple myeloma. Exp Hematol Oncol. 2022;11:49. doi: 10.1186/s40164-022-00303-z. - DOI - PMC - PubMed
    1. Martin T, Usmani SZ, Berdeja JG, et al. Ciltacabtagene Autoleucel, an Anti–B-cell Maturation Antigen Chimeric Antigen Receptor T-Cell Therapy, for Relapsed/Refractory Multiple Myeloma: CARTITUDE-1 2-Year Follow-Up. JCO. 2023;41:1265–74. doi: 10.1200/JCO.22.00842. - DOI - PMC - PubMed
    1. Lee H, Ahn S, Maity R, et al. Mechanisms of antigen escape from BCMA- or GPRC5D-targeted immunotherapies in multiple myeloma. Nat Med. 2023;29:2295–306. doi: 10.1038/s41591-023-02491-5. - DOI - PMC - PubMed
    1. Van der Vreken A, Vanderkerken K, De Bruyne E, et al. Fueling CARs: metabolic strategies to enhance CAR T-cell therapy. Exp Hematol Oncol. 2024;13:66. doi: 10.1186/s40164-024-00535-1. - DOI - PMC - PubMed
    1. Röllig C, Schmidt C, Bornhäuser M, et al. Induction of cellular immune responses in patients with stage-I multiple myeloma after vaccination with autologous idiotype-pulsed dendritic cells. J Immunother. 2011;34:100–6. doi: 10.1097/CJI.0b013e3181facf48. - DOI - PubMed

MeSH terms