. 2025 Apr 29;13(4):e010889.
doi: 10.1136/jitc-2024-010889.

Selective BCL-2 inhibitor triggers STING-dependent antitumor immunity via inducing mtDNA release

Affiliations

Selective BCL-2 inhibitor triggers STING-dependent antitumor immunity via inducing mtDNA release

Wenxin Zhang et al. J Immunother Cancer. .

Abstract

Background: The stimulator of interferon genes (STING) signaling pathway has been demonstrated to propagate the cancer-immunity cycle and remodel the tumor microenvironment and has emerged as an appealing target for cancer immunotherapy. Interest in STING agonist development has increased, and the candidates hold significant promise; however, most are still in the early stages of human clinical trials. We found that ABT-199 activated the STING pathway to enhance the immunotherapeutic effect, and provided a ready-to-use small molecule drug for STING signaling activation.

Methods: Phosphorylation of STING, TBK1, and IRF3, as well as activation of the interferon-I (IFN-I) signaling pathway, were detected following ABT-199 treatment in various colorectal cancer cells. C57BL/6J and BALB/c mice with subcutaneous tumors were employed to evaluate the in vivo therapeutic effects of the ABT-199 and anti-PD-L1 combination. Flow cytometry and ELISA were employed to analyze the level and activity of tumor-infiltrating T lymphocytes. Immunofluorescence and quantitative real-time PCR were conducted to assess the source and accumulation of double stranded DNA (dsDNA) in the cytoplasm. Chemical cross-linking assay, co-immunoprecipitation, and CRISPR/Cas9-mediated knockout were performed to investigate the molecular mechanism underlying ABT-199-induced voltage-dependent anion channel protein 1 (VDAC1) oligomerization and mitochondrial DNA (mtDNA) release.

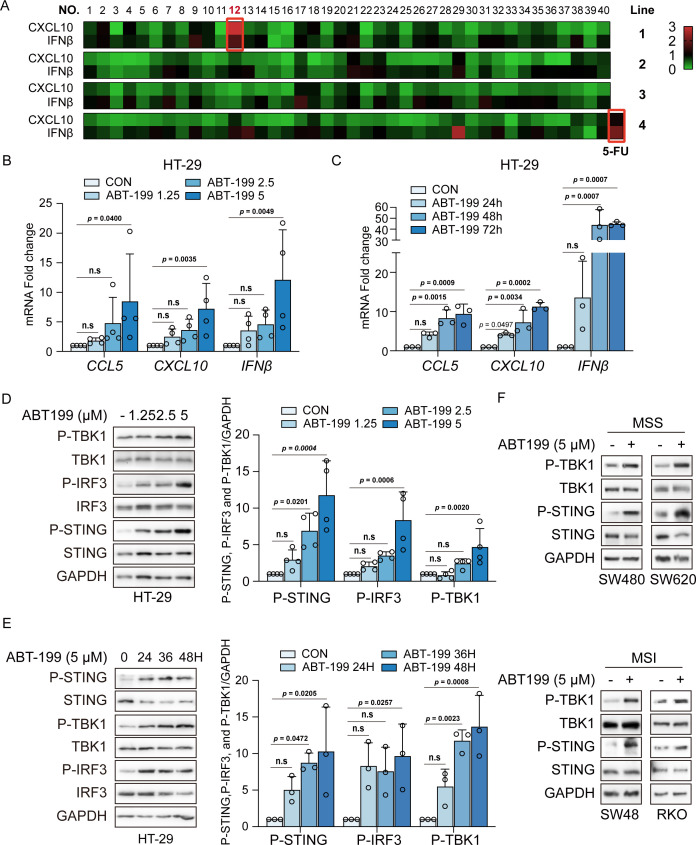
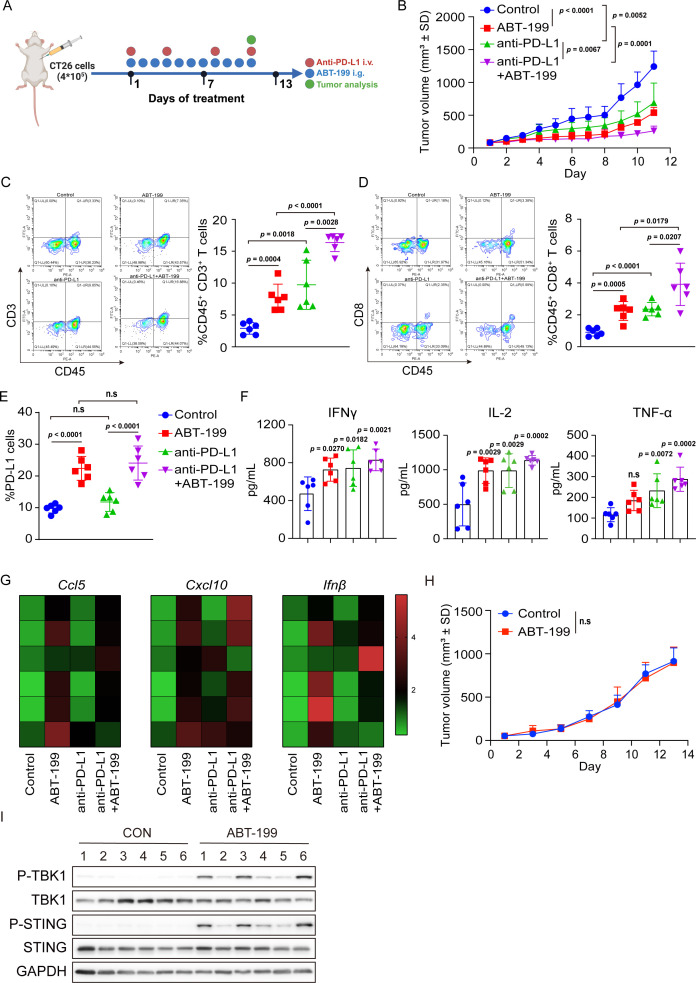
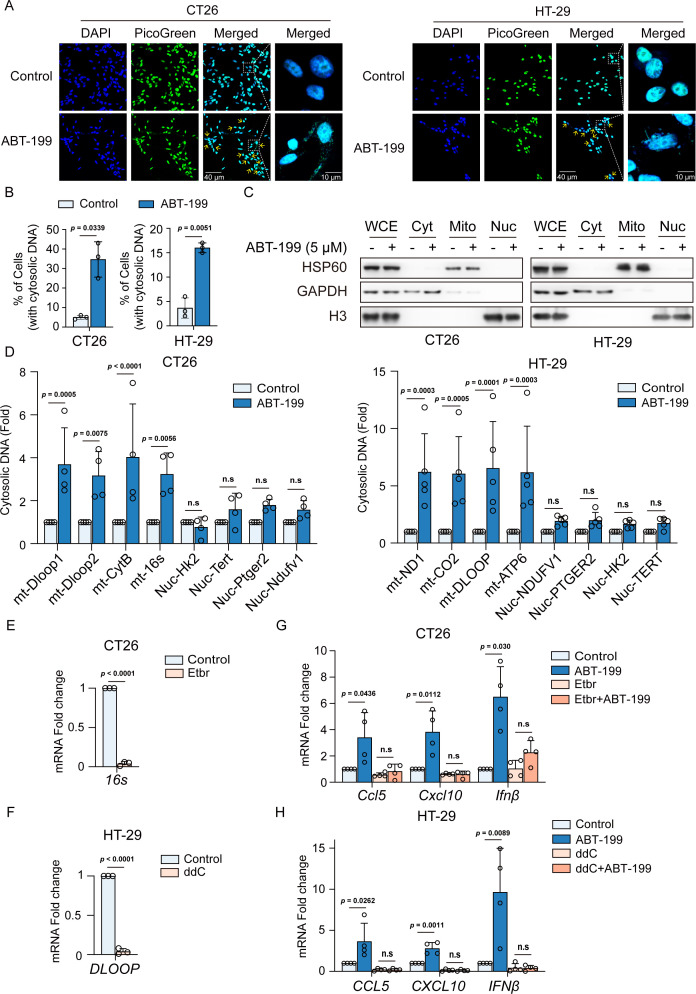
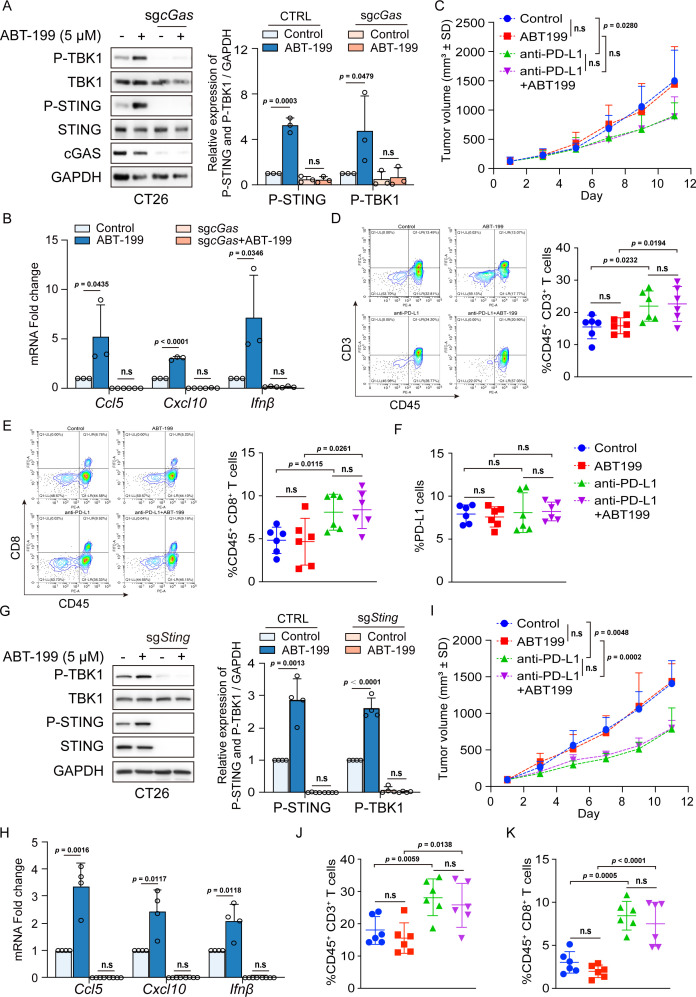
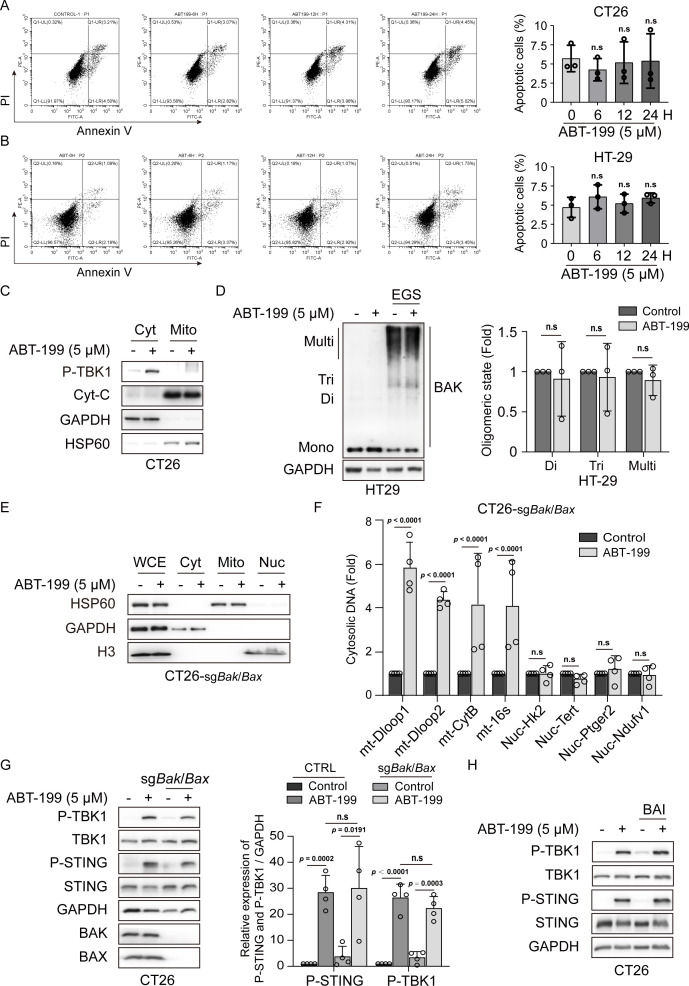
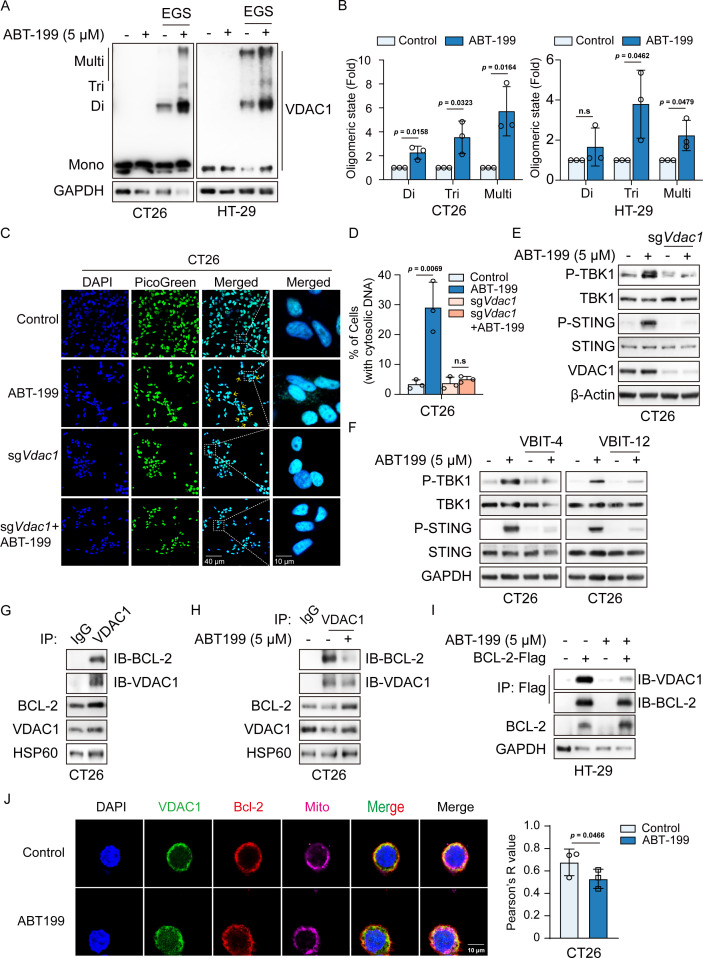
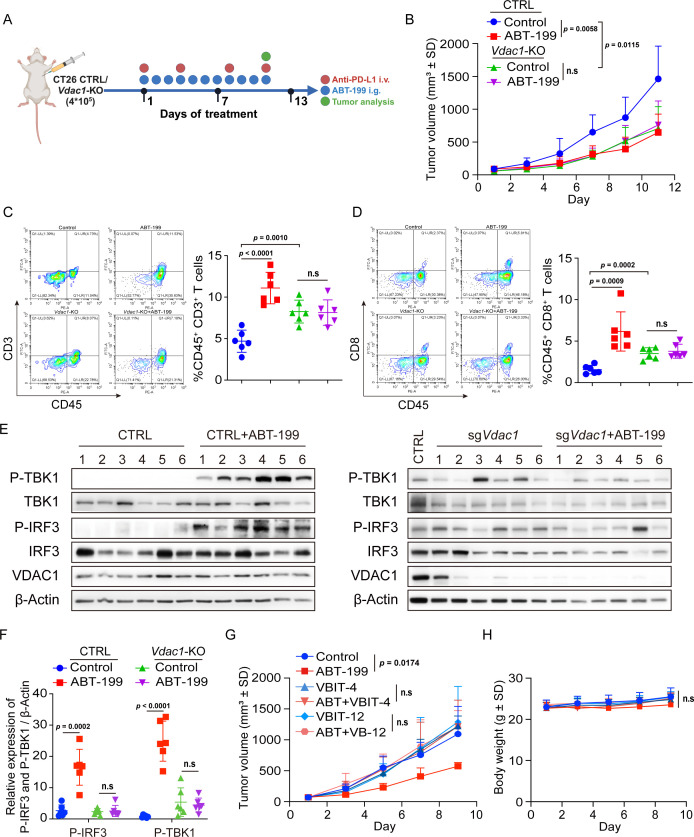
Results: ABT-199 significantly activated the STING signaling pathway in various colorectal cancer cells, which was evidenced by increased phosphorylation of TBK1 and IRF3, and upregulation of C-C motif chemokine ligand 5 (CCL5), C-X-C motif chemokine ligand 10 (CXCL10), and interferon beta transcription. By promoting chemokine expression and cytotoxic T-cell infiltration, ABT-199 promoted antitumor immunity and synergized with anti-PD-L1 therapy to improve antitumor efficacy. ABT-199 induced mtDNA accumulation in the cytoplasm and triggered STING signaling via the canonical pathway. cGAS or STING-KO models significantly abolished both STING signaling activation and the antitumor efficacy of ABT-199. Mechanically, ABT-199 promoted VDAC1 oligomerization by disturbing the binding between BCL-2 and VDAC1, thereby facilitating mtDNA release into the cytoplasm. ABT-199-triggered STING signaling was attenuated when VADC1 was knocked out. Consistently, the antitumor effect of ABT-199 in vivo was abolished in the absence of VDAC1.

Conclusions: Our results identify a ready-to-use small molecule compound for STING activation, reveal the underlying molecular mechanism through which ABT-199 activates the STING signaling pathway, and provide a theoretical basis for the use of ABT-199 in cancer immunotherapy.

Keywords: Colorectal Cancer; Cytokine; Immune Checkpoint Inhibitor; Immunotherapy.


Conflict of interest statement

Competing interests: No, there are no competing interests.

Figures

Figure 1
Figure 1. ABT-199 activated the STING signaling pathway in colorectal cancer. (A) The effect of small-molecule drugs on CXCL10 and IFNβ secretion. HT-29 cells were treated with a compound library containing 161 clinically used and tested anticancer drugs, at a concentration of 5 µM for 24 hours, then cell-free supernatants were collected and analyzed for CXCL10 and IFNβ secretion by ELISA. Relative expression compared with the control group was shown with a heatmap. Control group: HT-29 cells were treated with DMSO alone. (B and C) Transcription levels of CCL5, CXCL10, and IFNβ in HT-29 cells treated with ABT-199 (1.25, 2.5, and 5 µM) for 24 hours (B) or cells treated with ABT-199 (5 µM) for 24, 48, and 72 hours (C) were analyzed by qRT-PCR. (D and E) The P-TBK1, TBK1, P-IRF3, IRF3, P-STING, and STING proteins in HT-29 cells with indicated concentrations of ABT-199 (1.25, 2.5, and 5 µM) for 24 hours (D) or cells treated with ABT-199 (5 µM) for 24, 36, and 48 hours (E) were evaluated by western blot. The relative expression of P-TBK1, P-IRF3, and P-STING was analyzed quantitatively by Image J analysis. (F) The P-TBK1, TBK1, P-STING, and STING proteins in MSS cell lines (SW480 and SW620) and MSI cell lines (SW48 and RKO) treated with ABT-199 (5 µM) for 24 hours were evaluated by western blot. Data represent the mean±SD (C and E, n=3; B and D, n=4). The statistical difference in the data was analyzed by one-way analysis of variance with Dunnett’s post hoc test. CCL5, C-C motif chemokine ligand 5; CXCL10, C-X-C motif chemokine ligand 10; DMSO, dimethyl sulfoxide; IFNβ, interferon beta; MSI, microsatellite instability; MSS, microsatellite-stable; mRNA, messenger RNA; n.s, no significance; qRT-PCR, quantitative reverse transcription polymerase chain reaction; STING, stimulator of interferon genes.
Figure 2
Figure 2. ABT-199 synergized with anti-PD-L1 to inhibit CT26 tumor growth in vivo. (A) Schematic diagram of the experimental procedure: BALB/c mice were inoculated with CT26 cells. Subsequently, the mice were treated with ABT-199 (100 mg/kg) and anti-PD-L1 (10 mg/kg) either individually or in combination. Tumor volume, T-cell infiltration, and the STING signaling pathway were subsequently assessed. (B) Tumor growth curves of immunocompetent BALB/c mice treated with ABT-199, anti-PD-L1, or a combination of ABT-199 and anti-PD-L1. (C and D) The tumor-infiltrating CD45+CD3+ T cells (C) and CD45+CD8+ T cells (D) were detected by flow cytometry. (E) Cell-surface PD-L1 was analyzed by flow cytometry. (F) Tumor-secreted IFNγ, IL-2, and TNF-α were collected and analyzed by ELISA. (G) Tumor tissues were separated and the messenger RNA levels of Ccl5, Cxcl10, and Ifnβ were measured by qRT-PCR. (H) Tumor growth curves of BALB/c nude mice treated with ABT-199 (100 mg/kg). (I) CT26 tumor tissues were separated and the P-TBK1, P-STING, TBK1, and STING expression were detected by western blot. Data were presented as the mean±SD (n=6). Statistical analysis of the data was performed by Student’s t-test (two groups) and one-way analysis of variance with Dunnett’s post hoc test (more than two groups). CCL5, C-C motif chemokine ligand 5; CXCL10, C-X-C motif chemokine ligand 10; IFN, interferon; i.g., intragastric; IL, interleukin; i.v., intravenous injection; n.s, no significance; PD-L1, programmed death-ligand 1; STING, stimulator of interferon gene; TNF, tumor necrosis factor.
Figure 3
Figure 3. ABT-199 induced mitochondrial-derived cytosolic dsDNA release to activate the stimulator of interferon gene signaling pathway. (A and B) Representative images (A) and quantitative analysis (B) of dsDNA reagent staining in CT26 and HT29 cells treated with DMSO or ABT-199 (5 µM) for 24 hours. DAPI (blue) was used to visualize the nucleus. Scale bar: 40 µm and 10 µm. (C) CT26 and HT29 cells were treated with ABT-199 (5 µM) for 24 hours, then fractionated into WCE, Cyt, Mito, and Nuc fractions and subjected to analysis using western blot. GAPDH, HSP60, and H3 were used as markers for Cyt, Mito, and Nuc fractions. (D) DNA from each fraction was purified, and Dloop1, Dloop2, CytB, 16s, Hk2, Tert, Ptger2, and Ndufv1 expression levels were detected by qRT-PCR. (E) CT26 cells were treated with EtBr (250 ng/mL) for 7 days, and the mRNA levels of 16s were evaluated by qRT-PCR. (F) HT-29 cells were treated with ddC (1 µM) for 7 days, and the mRNA levels of DLOOP were evaluated by qRT-PCR. (G) CT26 cells were treated with EtBr (250 ng/mL) for 7 days, and then treated with ABT-199 (5 µM) for 24 hours. Subsequently, transcription levels of Ccl5, Cxcl10, and Ifnβ mRNA were quantified by qRT-PCR. (H) HT-29 cells were treated with ddC (1 µM) for 7 days, followed by ABT-199 (5 µM) treatment for 24 hours. Then transcription levels of CCL5, CXCL10, and IFNβ mRNA were quantified using qRT-PCR. Data represented the mean±SD (B, E and F, n=3; D, G and H, n=4). Statistical analysis of the data was performed by Student’s t-test (two groups) and two-way analysis of variance with Dunnett’s post hoc test (more than two groups). CCL5, C-C motif chemokine ligand 5; CXCL10, C-X-C motif chemokine ligand 10; DAPI, 4',6-Diamidino-2-phenylindole; ddC, dideoxycytidine; DMSO, dimethyl sulfoxide; double stranded DNA, dsDNA; EtBr, ethidium bromide; IFN, interferon; mRNA, messenger RNA; n.s, no significance; qRT-PCR, quantitative reverse transcription polymerase chain reaction.
Figure 4
Figure 4. cGAS or STING depletion impaired ABT-199-induced proinflammatory signaling and antitumor efficacy. (A and B) CRISPR/Cas9 control and cGas-KO cells were administered with ABT-199 (5 µM) for 24 hours and subjected to immunoblotting for P-TBK1, TBK1, P-STING, STING, and cGAS levels (A), or qRT-PCR for Ccl5, Cxcl10 and Ifnβ mRNA (B). (C) The tumor volume of BALB/c mice bearing the cGas-KO CT26 cells after treatment of ABT-199 (100 mg/kg) and anti-PD-L1 (10 mg/kg) alone or in combination. (D and E) The infiltration of CD45+CD3+ T cells (D) and CD45+CD8+ T cells (E) into tumors was measured by flow cytometry. (F) PD-L1 levels on the surface of tumor cells were analyzed by flow cytometry. (G and H) CRISPR/Cas9 control and Sting-KO cells were administered with ABT-199 (5 µM) for 24 hours and subjected to immunoblotting for P-TBK1, TBK1, P-STING, and STING levels (G), or qRT-PCR for Ccl5, Cxcl10 and Ifnβ mRNA (H). (I) The tumor volume of BALB/c mice bearing the Sting-KO CT26 cells after treatment of ABT-199 (100 mg/kg) and anti-PD-L1 (10 mg/kg) alone or in combination. (J and K) The infiltration of CD45+CD3+ T cells (J) and CD45+CD8+ T cells (K) into tumors was measured by flow cytometry. Data were presented as the mean±SD (A and B, n=3; G and H, n=4; C, D, E, F, I, G, and K, n=6). Statistical analysis of the data was performed by Student’s t-test (two groups). CCL5, C-C motif chemokine ligand 5; cGAS, cyclic GMP-AMP synthase; CXCL10, C-X-C motif chemokine ligand 10; IFN, interferon; mRNA, messenger RNA; n.s, no significance; PD-L1, programmed death-ligand 1; qRT-PCR, quantitative reverse transcription polymerase chain reaction; STING, stimulator of interferon gene.
Figure 5
Figure 5. BAK/BAX was not required for ABT-199-mediated STING pathway activation. (A and B) CT26 (A) and HT29 (B) cells were treated with ABT-199 (5 µM) for 6, 12, and 24 hours, and cell apoptotic rate was measured by flow cytometry with Annexin V/PI staining. (C) CT26 cells were treated with ABT-199 (5 µM) for 24 hours, and the P-TBK1 and cytochrome C proteins expression in the Cyt and Mito fractions was detected by western blot. GAPDH and HSP60 were used as markers for Cyt and Mito fractions. (D) HT-29 cells were treated with ABT-199 (5 µM) for 24 hours, followed by the treatment of cross-linking agent EGS (250 mM, 40 min, and 37°C) to stabilize oligomers. Subsequently, the BAK oligomers were detected by western blot and quantitatively analyzed by Image J analysis. (E) Bak/Bax-DKO CT26 cells were treated with ABT-199 (5 µM) for 24 hours, then fractionated into WCE, Cyt, Mito, and Nuc fractions and subjected to analysis using western blot. GAPDH, HSP60, and H3 were used as markers for Cyt, Mito, and Nuc fractions. (F) DNA from each fraction was purified, and Dloop1, Dloop2, CytB, 16s, Hk2, Tert, Ptger2, and Ndufv1 expression levels were detected by qRT-PCR. (G) CRISPR/Cas9 control or BAK/BAX double-KO cells were treated with ABT-199 (5 µM) for 24 hours and subjected to immunoblotting for P-TBK1, TBK1, P-STING, STING, BAK, and BAX levels. The relative expression of P-TBK1 and P-STING was analyzed quantitatively by Image J analysis. (H) CT26 cells were treated with ABT-199 (5 µM) alone or together with BAI1 (2 µM) for 24 hours, and the P-TBK1, TBK1, P-STING, and STING proteins were detected by western blot. Data represented the mean±SD (A, B, and D, n=3; E, F, and G, n=4). Statistical analysis of the data was performed by Student’s t-test (two groups) and one/two-way analysis of variance with Dunnett’s post hoc test (more than two groups). n.s, no significance; qRT-PCR, quantitative reverse transcription polymerase chain reaction; STING, stimulator of interferon gene.
Figure 6
Figure 6. ABT-199 induced VDAC1 oligomerization by inhibiting the interaction between BCL-2 and VDAC1. (A and B) CT26 and HT-29 cells were treated with ABT-199 (5 µM) for 24 hours, followed by the treatment of cross-linking agent EGS (250 mM, 40 min, and 37°C) to stabilize oligomers. Subsequently, the VDAC1 oligomers were detected by western blot (A) and quantitatively analyzed by Image J analysis (B). (C and D) Representative images (C) and quantitative analysis (D) of dsDNA reagent staining in CRISPR/Cas9 control or VDAC1 KO cells treated with DMSO or ABT-199 (5 µM) for 24 hours. DAPI (blue) was used to visualize the nucleus. Scale bar: 40 µm and 10 µm. (E) CRISPR/Cas9 control or VDAC1 KO cells were treated with ABT-199 (5 µM) for 24 hours and subjected to immunoblotting for P-TBK1, TBK1, P-STING, STING, and VDAC1 levels. (F) CT26 cells were treated with VBIT-4/VBIT-12 (10 µM) alone or in combination with ABT-199 (5 µM) for 24 hours, then the P-TBK1, TBK1, P-STING, and STING protein expression was measured by western blot. (G) BCL-2 bound with VDAC1 on mitochondria. Mitochondria extracted from CT26 cells were lysed and immunoprecipitated with anti-VDAC1 and anti-IgG, which was followed by immunoblotting with the BCL-2 antibody. (H) ABT-199 disrupted the endogenous interaction between BCL-2 and VDAC1. Mitochondria extracted from CT26 cells treated with ABT-199 (5 µM) for 24 hours were lysed and immunoprecipitated with anti-VDAC1 and anti-IgG, which was followed by immunoblotting with the BCL-2 antibody. (I) ABT-199 inhibited the binding of VDAC1 and BCL-2. HT-29 cells were transfected with BCL-2-Flag, and then cells were treated with ABT-199 (5 µM) for 24 hours. The cells were immunoprecipitated with anti-Flag, which was followed by immunoblotting with the VDAC1 antibody. (J) ABT-199 inhibited the binding of VDAC1 and BCL-2 at the mitochondrial membrane. CT26 cells were treated with ABT-199 (5 µM) for 24 hours, followed by staining using the MitoTracker dyes to label mitochondria, and detected the interaction between VDAC1 and BCL-2 at the mitochondrial membrane by immunofluorescence assays. Scale bar: 10 µm. Data represented the mean±SD (B, D, and J, n=3). Statistical analysis of the data was performed by Student’s t-test. DAPI, 4',6-Diamidino-2-phenylindole; DMSO, dimethyl sulfoxide; double stranded DNA, dsDNA; n.s, no significance; STING, stimulator of interferon gene; VDAC1, voltage-dependent anion channel protein 1.
Figure 7
Figure 7. Vdac1 depletion impaired ABT-199-induced T-cell recruitment and antitumor efficacy. (A) Schematic diagram of the experimental procedure: BALB/c mice were inoculated with CTRL and Vdac1-KO CT26 cells. Then the mice were treated with ABT-199 (100 mg/kg) daily, and the tumor size, T-cell infiltration, and STING signaling pathway activation were assessed. (B) The tumor volume of BALB/c mice bearing the CTRL and Vdac1-KO CT26 cells. (C and D) The tumor-infiltrating CD45+CD3+ T cells (C) and CD45+CD8+ T cells (D) were analyzed by flow cytometry. (E and F) Tumor tissues were separated, and the expression of P-TBK1, TBK1, P-IRF3, IRF3, and VDAC1 proteins was detected by western blot. (G and H) BALB/c mice were inoculated with CT26 cells. Subsequently, the mice were treated with ABT-199 (100 mg/kg) and VBIT-4 (20 mg/kg), VBIT-12 (20 mg/kg) either individually or in combination. Tumor growth curves and body weight were assessed. Data were the mean±SD (n=6). The data were analyzed by Student’s t-test. i.g., intragastric; i.v., intravenous; n.s, no significance; PD-L1, programmed death-ligand 1; VDAC1, voltage-dependent anion channel protein 1.

Similar articles

Cited by

References

    1. Zheng J, Mo J, Zhu T, et al. Comprehensive elaboration of the cGAS-STING signaling axis in cancer development and immunotherapy. Mol Cancer. 2020;19:133. doi: 10.1186/s12943-020-01250-1. - DOI - PMC - PubMed
    1. Ng KW, Marshall EA, Bell JC, et al. cGAS-STING and Cancer: Dichotomous Roles in Tumor Immunity and Development. Trends Immunol. 2018;39:44–54. doi: 10.1016/j.it.2017.07.013. - DOI - PubMed
    1. Garland KM, Sheehy TL, Wilson JT. Chemical and Biomolecular Strategies for STING Pathway Activation in Cancer Immunotherapy. Chem Rev. 2022;122:5977–6039. doi: 10.1021/acs.chemrev.1c00750. - DOI - PMC - PubMed
    1. Zhu Y, An X, Zhang X, et al. STING: a master regulator in the cancer-immunity cycle. Mol Cancer. 2019;18:152. doi: 10.1186/s12943-019-1087-y. - DOI - PMC - PubMed
    1. Huang R, Ning Q, Zhao J, et al. Targeting STING for cancer immunotherapy: From mechanisms to translation. Int Immunopharmacol. 2022;113:109304. doi: 10.1016/j.intimp.2022.109304. - DOI - PubMed

LinkOut - more resources