. 2025 Sep 8;74(10):1602-1615.
doi: 10.1136/gutjnl-2024-333729.

Integrated multimodel analysis of intestinal inflammation exposes key molecular features of preclinical and clinical IBD

Collaborators, Affiliations

Integrated multimodel analysis of intestinal inflammation exposes key molecular features of preclinical and clinical IBD

Miguel Gonzalez-Acera et al. Gut. .

Abstract

Background: IBD is a chronic inflammatory condition driven by complex genetic and immune interactions, yet preclinical models often fail to fully recapitulate all aspects of the human disease. A systematic comparison of commonly used IBD models is essential to identify conserved molecular mechanisms and improve translational relevance.

Objective: We performed a multimodel transcriptomic analysis of 13 widely used IBD mouse models to uncover coregulatory gene networks conserved between preclinical colitis/ileitis and human IBD and to define model-specific and conserved cellular, subcellular and molecular signatures.

Design: We employed comparative transcriptomic analyses with curated and a priori statistical correlative methods between mouse models versus IBD patient datasets at both bulk and single-cell levels.

Results: We identify IBD-related pathways, ontologies and cellular compositions that are translatable between mouse models and patient cohorts. We further describe a conserved core inflammatory signature of IBD-associated genes governing T-cell homing, innate immunity and epithelial barrier that translates into the new mouse gut Molecular Inflammation Score (mMIS). Moreover, specific mouse IBD models have distinct signatures for B-cell, T-cell and enteric neurons. We discover that transcriptomic relatedness of models is a function of the mode of induction, not the canonical immunotype (Th1/Th2/Th17). Moreover, the model compendium database is made available as a web explorer (http://trr241.hosting.rrze.uni-erlangen.de/SEPIA/).

Conclusion: This integrated multimodel approach provides a framework for systematically assessing the molecular landscape of intestinal inflammation. Our findings reveal conserved inflammatory circuits, refine model selection, offering a valuable resource for the IBD research community.

Keywords: CROHN'S DISEASE; IBD MODELS; INFLAMMATORY BOWEL DISEASE; ULCERATIVE COLITIS.


Conflict of interest statement

Competing interests: None declared.

Figures
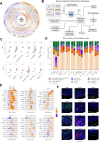
Figure 1
Figure 1. Changes in tissue cell composition across mouse models of IBD. (A) Scheme depicting the mouse model data bank for preclinical gut inflammation, highlighting the distribution of the broad categories: infection, barrier damage and immune modulation (B) Flowchart depicting establishment of the transcriptomic databank SEPIA for mouse IBD models including model screening selection, quality control (QC), and analyses steps. (C) Mouse mucosal Molecular Inflammation Score (mMIS) across models compared with respective controls (*** indicates padj <0.05, EB moderated t-test). (D) Deconvolved cell type signatures across colonic models. Inflamed samples are shown next to controls. The columns Ctrl_OxC and Ctrl_Crode are shared reference controls for the two respective models (E) Ridge plots of the fold change of selected cell type marker genes across the colonic mouse models. (F) Immunofluorescence staining for markers for macrophages (green, first column), goblet cells (green, second column), transit amplifying cells (red, second column), enteric neurons (green, third column) and enteric glia (red, third column) across the indicated models from each category. WGCNA, weighted correlation network analysis.
Figure 2
Figure 2. Regulatory commonalities and differences between mouse models. (A) Venn diagram showing the common upregulated genes between the indicated colitis models and (B) those between ileitis models. (C–D) Semantic similarity networks from the enriched GO terms observed in the upregulated gene set from the common datasets defined in A and B, respectively. (E) Venn diagrams showing the common downregulated genes between the indicated colitis models and (F) those between the ileitis models. (G–H) Term similarity network of the enriched GO terms observed in the downregulated gene set from the common datasets defined in E and F, respectively. (I) Variation in the relative expression of deconvolved hallmark pathways per mouse model showing variation profiles across the model dataset. GO, gene ontology.
Figure 3
Figure 3. Weighted gene coexpression network analysis (WGCNA) across the mouse model datasets. (A–B) Variation observed in the modules obtained from the WGCNA applied to colitis and ileitis samples from the mouse model dataset. Changes labelled with ✽ indicate postlimma p values of <0.05. (C–D) Top three gene ontologies enriched in selected modules from the WGCNA of colitis (C) and ileitis, (D) respectively. (E–F) Heatmap of the enriched genes from the selected WGCNA modules from the colitis and ileitis mouse models, respectively.
Figure 4
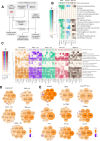
Figure 4. Regulatory conservation between mouse model and patient cohorts of IBD-associated features. (A) Flowchart depicting the analysis steps involved in statistical comparisons of transcriptomes generated from the SEPIA mouse model databank versus human IBD cohorts (B–C) Correlation sets for selected ontologies between (B) multiple mouse colitis models versus human UC cohort transcriptomes and (C) mouse ileitis models versus human CD cohort transcriptomes. Colour intensity represents the R2 value. Framed cells denote a significant p value in the regression test (p<0.05). Cells marked with an [X] had <10 genes in common, and the regression was not performed (D–E). Cytokine expression changes across (D) colonic human IBD cohorts and (E) colonic mouse inflammation models. Only cytokines reaching statistical significance (padj <0.05, Wald test) were included. The colour and the size of each bubble represent the expression fold change of each gene respective to control. The colour scale is constant between diagrams. The relative size scale represents absolute fold changes. CD, Crohn’s disease.
Figure 5
Figure 5. Conserved ontologies are expressed by unique IBD-associated single cell clusters. (A) Volcano plots of the indicated UC patient cohort where (left) orthologues from the common upregulated genes from colitis mouse models and (right) downregulated genes are shown. All genes commonly regulated among mouse colitis models and reaching the significance threshold of padj <0.05 (Wald test) are highlighted in orange or purple, and those belonging to the WGCNA mouse colitis modules ME116 and ME32 are labelled in red. (B) Volcano plots of the indicated CD patient cohort where (left) orthologues from the common upregulated gene set from ileitis mouse models and (right) downregulated genes reaching the significance threshold of padj <0.05 (Wald test) are highlighted in orange or purple. All genes commonly regulated among mouse models are highlighted, and those belonging to the WGCNA mouse ileitis modules ME2 and ME1 are labelled in red. (C–E) scRNA-Seq clusters of (C) epithelial, (D) immune and (E) stromal compartments from Smillie et al. Left: t-distributed stochastic neighbor embedding (t-SNE) clusters, middle: t-SNEs segregated by patient health where colour represents the average gene expression of selected pathways from the WGCNA modules, and right: violin plots showing the changes of the average expression in each of the annotated clusters. WGCNA, weighted correlation network analysis.
Figure 6
Figure 6. Schematic illustration of the key model-to-model and preclinical-vs-clinical IBD changes identified in the study.

References

    1. Neurath MF. Host-microbiota interactions in inflammatory bowel disease. Nat Rev Gastroenterol Hepatol. 2020;17:76–7. doi: 10.1038/s41575-019-0248-1. - DOI - PubMed
    1. Neurath MF. Targeting cytokines in inflammatory bowel disease. Sci Transl Med. 2022;14:eabq4473. doi: 10.1126/scitranslmed.abq4473. - DOI - PubMed
    1. Friedrich M, Pohin M, Powrie F. Cytokine Networks in the Pathophysiology of Inflammatory Bowel Disease. Immunity. 2019;50:992–1006. doi: 10.1016/j.immuni.2019.03.017. - DOI - PubMed
    1. Sazonovs A, Stevens CR, Venkataraman GR, et al. Large-scale sequencing identifies multiple genes and rare variants associated with Crohn’s disease susceptibility. Nat Genet. 2022;54:1275–83. doi: 10.1038/s41588-022-01156-2. - DOI - PMC - PubMed
    1. de Lange KM, Moutsianas L, Lee JC, et al. Genome-wide association study implicates immune activation of multiple integrin genes in inflammatory bowel disease. Nat Genet. 2017;49:256–61. doi: 10.1038/ng.3760. - DOI - PMC - PubMed

LinkOut - more resources