. 2025 Sep 8;74(10):1589-1601.
doi: 10.1136/gutjnl-2024-334346.

DUOX2 activation drives bacterial translocation and subclinical inflammation in IBD-associated dysbiosis

Affiliations

DUOX2 activation drives bacterial translocation and subclinical inflammation in IBD-associated dysbiosis

Hajar Hazime et al. Gut. .

Abstract

Background: Inflammatory bowel diseases (IBDs) are characterised by dysbiosis and a leaky gut. The NADPH oxidase dual oxidase 2 (DUOX2) is upregulated in patients with IBD, yet its role in driving the disease remains unclear.

Objective: We interrogated the functional consequences of epithelial DUOX2 activity for the host and microbiome.

Design: DUOX2 function was studied in mice with epithelial-specific DUOX2 overactivation (vTLR4), inactivation (vTLR4 DUOXA IEC-KO) and wild-type controls. We assessed the effect of dysbiosis on DUOX2 signalling and intestinal permeability (FITC-dextran, serum zonulin, bacterial translocation) with germ-free (GF) mice engrafted with IBD or healthy microbiota. RNA sequencing of colonic mucosa and microbiota and faecal metabolomics were used to characterise the host-microbe interface. Mechanistic studies were conducted in mouse colonoids, IBD biopsies and patient serum samples.

Results: DUOX2 activity increased permeability and bacterial translocation and induced subclinical inflammation in vTLR4 mice. GF vTLR4 mice had increased DUOX2 activity and permeability but no subclinical inflammation. In patients with IBD, DUOX2 expression was positively associated with plasma zonulin levels and negatively associated with ZO-1 expression. Engraftment of GF mice with IBD stool increased DUOX2 activity and triggered low-grade inflammation and permeability defects in mice. DUOX2 activity functionally altered the microbiome, reduced butyrate metabolism and promoted proinflammatory and pro-oncogenic bacterial metabolites. Butyrate and histone deacetylase (HDAC) inhibitors blocked DUOX2 activation and reversed its effects.

Conclusions: Elevated DUOX2 signalling contributes to epithelial barrier dysfunction, microbiome alterations and subclinical inflammation. Butyrate and HDAC inhibitors reversed these effects, indicating that DUOX2 may be a therapeutic target in IBD.

Keywords: INFLAMMATORY BOWEL DISEASE; INTESTINAL ENZYMES; INTESTINAL EPITHELIUM; INTESTINAL MICROBIOLOGY; REACTIVE OXYGEN SPECIES.


Conflict of interest statement

Competing interests: MTA serves as a consultant or on the advisory board of the following companies: AbbVie, Alimentiv, Amgen, Bristol Myers Squibb, Eli Lilly and Company, Genetech, Gilead Sciences, Janssen Pharmaceuticals, Pfizer Pharmaceutical, Takeda Pharmaceuticals, and UCB Pharma. CJ is an associate editor at Gut. All other authors have no conflicts of interest to declare.

Figures
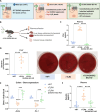
Figure 1
Figure 1. DUOX2 activation alters paracellular permeability. (A) Schematic of the animal models. (B) Schematic of the experimental design. (C) Quantification of plasma 4 kDa FITC-dextran (FD4) levels from villin-TLR4 (vTLR4) mice, vTLR4 mice with intestinal-specific knock-out of DUOXA1/2 (vTLR4 DUOXA IEC-KO mice), and wild-type littermates (vWT) (n=8). (D) Left, quantification of colony-forming units (CFU) per gram of liver tissue in the same mice (n=8). Right, representative macroscopic images of bacterial cultures cultivated from liver homogenates from all groups. (E) Gene expression analysis of junctional adhesion molecule A (Jama) and Zonula occludens 1 (Zo-1) in the colon of these mice (n=5). (F) Quantification of plasma zonulin levels in the same mice (n=8). Data were analysed by one-way ANOVA. (***p<0.001, ****p<0.0001). ANOVA, analysis of variance.
Figure 2
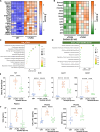
Figure 2. DUOX2 activation leads to proinflammatory and pro-oncogenic pathway activation. (A, B) Heat map showing selected differentially expressed genes based on RNA sequencing data from the mucosa of (A) villin-TLR4 (vTLR4) mice versus wild-type (vWT) littermates and (B) vTLR4 mice versus vTLR4 DUOXA IEC-KO mice (n=5). (C) Pathway analysis of activated pathways based on RNA sequencing data from the colonic tissue of vTLR4 mice versus their vWT littermates (n=5). (D) Pathway analysis of downregulated pathways based on RNA sequencing data from the colonic tissue of vTLR4 DUOXA IEC-KO mice versus vTLR4 mice (n=5). (E) Gene expression analysis of Tnf, Il1-β, Cxcl1 and Cxcl2 in colonic epithelial cells (CECs) from vTLR4 mice compared with vTLR4 DUOXA IEC-KO mice and vWT mice (n=8). (F) Quantification of plasma levels of serum amyloid A (SAA), CXCL1 and CXCL2 from the same mice (n=8). Data in E, F were analysed by one-way ANOVA (***p<0.001, ****p<0.0001). ANOVA, analysis of variance.
Figure 3
Figure 3. Germ-free (GF) vTLR4 mice exhibit increased paracellular permeability without low-grade inflammation. (A) Quantification of H2O2 production rates from freshly isolated CECs from GF vWT mice, GF villin-TLR4 (vTLR4) mice, and specific pathogen-free (SPF) vTLR4 mice (n=5). (B) Quantification of plasma 4 kDa FITC-dextran (FD4) levels from GF vTLR4 mice and GF vWT littermates (n=6) (unpaired t-test). (C) Quantification of plasma zonulin levels from the same mice (n=6) (unpaired t-test). (D) Gene expression quantification of Tnf, Il1b, Cxcl1 and Cxcl2 from colonic epithelial cells (CECs) from GF vWT mice, GF vTLR4 mice and SPF vTLR4 mice (n=6). (E) Plasma quantification of CXCL1 and CXCL2 in the same mice (n=5–8). Data in A, D, E were analysed by one-way ANOVA. (***p<0.001, ****p<0.0001). ANOVA, analysis of variance; WT, wild-type.
Figure 4
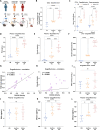
Figure 4. DUOX2 expression correlates with impaired epithelial barrier function in patients with IBD. (A) Schematic of measurements. (B) Quantification of calprotectin levels in stool samples from healthy subject (HS) controls (n=5) and ulcerative colitis (UC) patients with inactive (n=4) or active (n=5) disease. (C) Gene expression quantification of DUOX2, DUOXA2 and ZO-1 from biopsies from UC patients with inactive (n=4) and active (n=5) disease (unpaired t-test). (D) Quantification of plasma zonulin levels in the same groups. (E) Pearson correlation analysis of the relationship between DUOX2 expression and faecal calprotectin levels (r=0.8468, p=0.002, n=9). (F) Pearson correlation analysis of the relationship between DUOX2 expression and plasma zonulin levels (r=0.8322, p=0.005, n=9). A line of identity (y=x) is included for reference. Data in B–D were analysed by one-way ANOVA (*p<0.05, **p<0.01, ***p<0.001, ****p<0.0001). ANOVA, analysis of variance; IBD, inflammatory bowel diseases.
Figure 5
Figure 5. Engraftment of mice with IBD patient stool increases DUOX2 activity, bacterial translocation and subinflammatory status. (A) Schematic of experimental design. (B) Quantification of H2O2 production rates from freshly isolated colonic epithelial cells (CECs) from germ-free (GF) mice engrafted with stool from healthy subject (HS) controls (n=6) or UC patients with inactive (n=8) or active disease (n=10). (C) Duox2 and Duoxa2 gene expression analysis of mRNA extracted from CECs from the same mice (n=6). (D) Quantification of plasma levels of 4 kDa FITC-dextran (FD4) from the same mice. (E) Quantification of plasma zonulin levels from the same mice. (F) Quantification of colony-forming units (CFU) per gram of liver tissue from the same mice. (G) Pearson correlation analysis of the relationship between DUOX2 activity and plasma FD4 levels (r=0.7973, p<0.0001, n=24). (H) Pearson correlation analysis of the relationship between DUOX2 activity and plasma zonulin levels (r=0.7516, p=0.0001, n=24). A line of identity (y=x) is included for reference. (I) Quantification of myeloperoxidase (MPO) activity from colonic tissue from the same mice. Quantification of (J) serum amyloid A1 (SAA), (K) CXCL21 and (L) CXCL2 levels in the plasma of the same mice. Data were analysed by one-way ANOVA (*p<0.05, **p<0.01, ***p<0.001, ****p<0.0001). ANOVA, analysis of variance; IBD, inflammatory bowel disease.
Figure 6
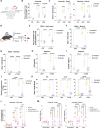
Figure 6. Increased DUOX2 activity drives functional alterations in the microbiome and metabolome. (A, B) Heat map showing differentially expressed gene (DEG) products according to RNA sequencing of the mucosa-associated microbiota (MAM) of (A) villin-TLR4 (vTLR4) mice vs wild-type (vWT) mice and (B) villin-TLR4 mice with knockout of DUOXA in intestinal epithelial cells (vTLR4 DUOXA IEC-KO mice) vs vTLR4 mice (n=5). (C, D) Variable importance plot (VIP) analysis of untargeted stool metabolites from (C) vWT versus vTLR4 mice and (D) vTLR4 DUOXA IEC-KO versus vTLR4 mice (n=8–9) (red=high, blue=low). (E, F) Pathway analysis of untargeted stool metabolomics data from (E) vTLR4 versus vWT mice (n=8–10) and (F) vTLR4 DUOXA IEC-KO versus vTLR4 mice (n=8–9).
Figure 7
Figure 7. Butyrate inhibits DUOX2-mediated H2O2 response and restores barrier integrity. (A) Schematic of experimental procedures. (B) Quantification of H2O2 production rates in wild-type (WT) colonoids pretreated with butyrate and cotreated with adherent, invasive Escherichia coli (AIEC) or IFN-γ, compared with that in untreated colonoids (n=6). (C) Duox2 and Duoxa2 gene expression analysis of mRNA extracted from the same colonoids (n=6). (D) Schematic of experimental design. (E) Quantification of H2O2 production rates from freshly isolated colonic epithelial cells (CECs) from WT (vWT) and villin-TLR4 (vTLR4) mice supplemented with butyrate (n=7) and from untreated mice (n=5–7). (F) Duox2 and (G) Duoxa2 gene expression analysis of mRNA extracted from freshly isolated CECs from the same mice. (H) Quantification of plasma levels of 4 kDa FITC-dextran (FD4) in the same mice (n=6). (I) Quantification of plasma zonulin levels in the same mice (n=6). (J) Quantification of colony-forming units (CFU) per gram of liver tissue from the same mice (n=6). (K) Gene expression analysis of Tnf, Cxcl1, and Cxcl2 from CECs from the same mice (n=5–7). (L) Quantification of H2O2 production rates in WT colonoids pretreated with the histone deacetylase (HDAC) inhibitors UF010 or TMP269 and cotreated with either AIEC or IFN-γ compared with those in untreated colonoids (n=8). (M) Duox2 and Duoxa2 gene expression analysis of mRNA extracted from the same colonoids (n=8). Data were analysed by two-way ANOVA (**p<0.01, ***p<0.001, ****p<0.0001). ANOVA, analysis of variance.

References

    1. Round JL, Palm NW. Causal effects of the microbiota on immune-mediated diseases. Sci Immunol. 2018;3:eaao1603. doi: 10.1126/sciimmunol.aao1603. - DOI - PubMed
    1. Fritsch J, Abreu MT. The Microbiota and the Immune Response: What Is the Chicken and What Is the Egg? Gastrointest Endosc Clin N Am. 2019;29:381–93. doi: 10.1016/j.giec.2019.02.005. - DOI - PubMed
    1. Turpin W, Lee S-H, Raygoza Garay JA, et al. Increased Intestinal Permeability Is Associated With Later Development of Crohn’s Disease. Gastroenterology. 2020;159:2092–100. doi: 10.1053/j.gastro.2020.08.005. - DOI - PubMed
    1. Torres J, Petralia F, Sato T, et al. Serum Biomarkers Identify Patients Who Will Develop Inflammatory Bowel Diseases Up to 5 Years Before Diagnosis. Gastroenterology. 2020;159:96–104. doi: 10.1053/j.gastro.2020.03.007. - DOI - PubMed
    1. Nagao-Kitamoto H, Shreiner AB, Gillilland MG, 3rd, et al. Functional Characterization of Inflammatory Bowel Disease-Associated Gut Dysbiosis in Gnotobiotic Mice. Cell Mol Gastroenterol Hepatol. 2016;2:468–81. doi: 10.1016/j.jcmgh.2016.02.003. - DOI - PMC - PubMed

LinkOut - more resources