. 2025 Apr 30;82(1):190.
doi: 10.1007/s00018-025-05720-x.

Degradation rather than disassembly of necrotic debris is essential to enhance recovery after acute liver injury

Affiliations

Degradation rather than disassembly of necrotic debris is essential to enhance recovery after acute liver injury

Sara Schuermans et al. Cell Mol Life Sci. .

Abstract

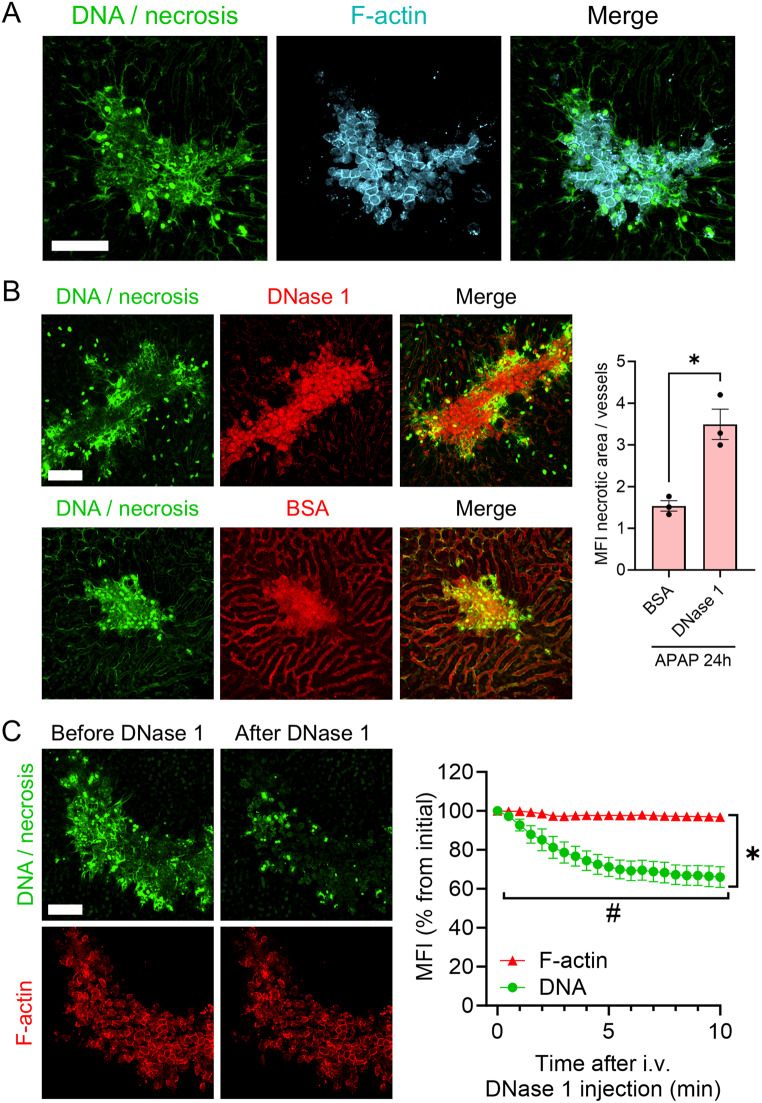
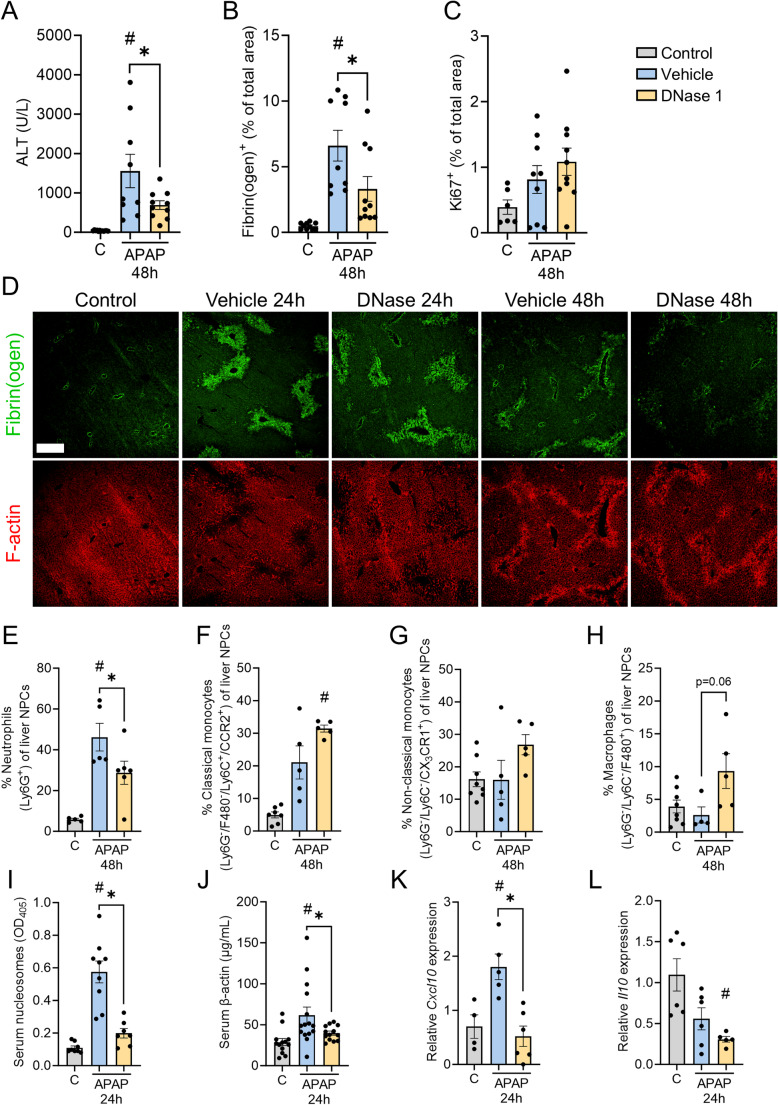
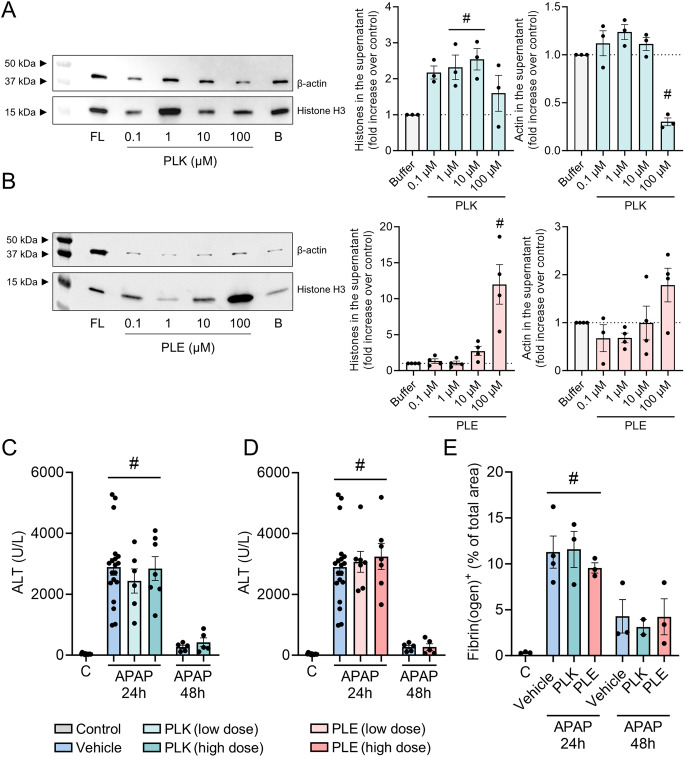
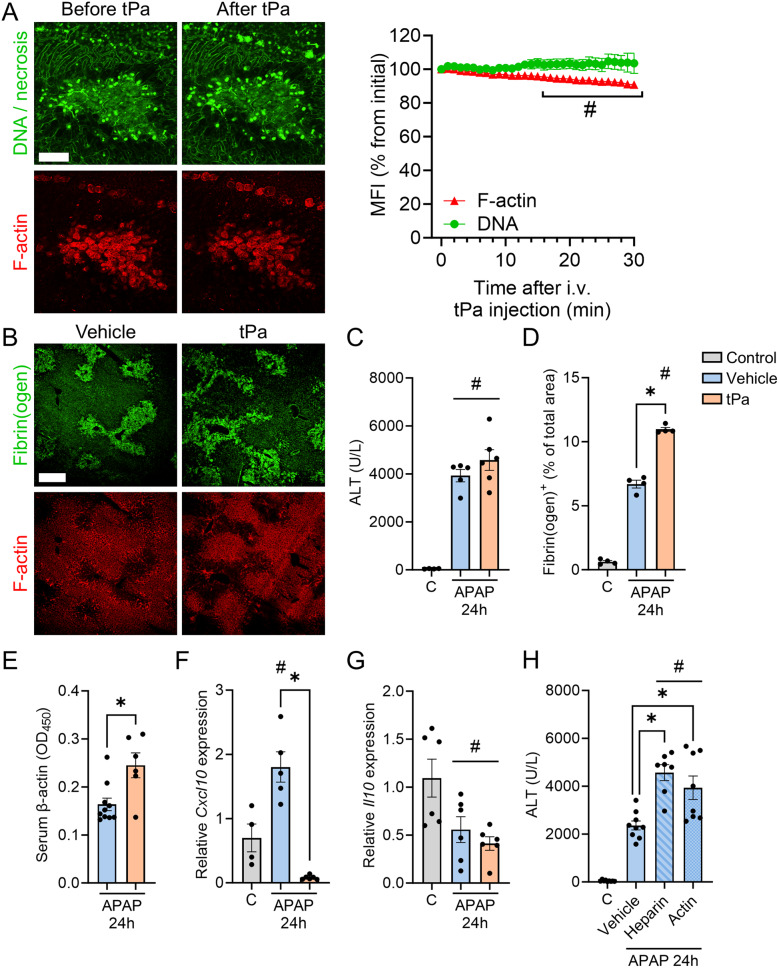
Necrotic cell death causes loss of membrane integrity, release of intracellular contents and deposition of necrotic cell debris. Effective clearance of this debris is crucial for resolving inflammation and promoting tissue recovery. While leukocyte phagocytosis plays a major role, soluble factors in the bloodstream also contribute to debris removal. Our study examined whether enzymatic degradation or disassembly of necrotic debris enhances clearance and improves outcomes in a mouse model of drug-induced liver injury. Using intravital microscopy and on-tissue spatially-resolved microproteomics, we demonstrated that necrotic debris is more complex than anticipated, containing DNA, filamentous actin, histones, complement C3, fibrin(ogen) and plasmin(ogen), among many other components. DNase 1 treatment facilitated recovery significantly by enhancing the clearance of DNA from necrotic areas, reducing circulating nucleosomes and actin, and lowering the associated inflammatory response. However, its effect on actin and other damage-associated molecular patterns in necrotic regions was limited. Treatment with short synthetic peptides, specifically 20-amino acid-long positively charged poly L-lysine (PLK) and negatively charged poly L-glutamic acid (PLE), which displace histones from debris in vitro, did not inhibit liver injury or promote recovery. Moreover, activating plasmin to disrupt fibrin encapsulation via tissue plasminogen activator (tPa) led to increased circulating actin levels and worsening of injury parameters. These findings suggest that fibrin encapsulation is important for containing necrotic debris and that enzymatic degradation of necrotic debris is a more effective strategy to enhance tissue recovery than targeting debris disassembly.

Keywords: Cell death; DNase; Fibrinolysis; Necrotic cell debris; Peptide.


Conflict of interest statement

Declarations. Ethical approval: The animal study was approved by the Ethical Committee for Animal Experiments from KU Leuven (registry number: P128/2021). The study was conducted in accordance with the local legislation and institutional requirements. Conflict of interest: The authors have no conflicts to disclose.

Figures

Fig. 1
Fig. 1
F-actin is found in necrotic areas alongside extracellular DNA and remains intact after DNase injection. (A) Representative intravital microscopy images of mice showing deposition of F-actin (Alexa Fluor 555 Phalloidin+, 2.2 µM) alongside extracellular DNA (SYTOX Green+, 10 µM) in the liver 24 h after APAP overdose (600 mg/kg). Green: DNA; Cyan: F-actin. (B) Representative intravital microscopy images of fluorescently labeled DNase 1 (Alexa Fluor 594, 50 µg) localizing to necrotic areas 24 h after APAP overdose, compared to fluorescently labeled bovine serum albumin (BSA) as a control. The mean fluorescent intensities (MFIs) of these dyes in the necrotic areas were normalized to the MFIs in the vessels. Data are represented as mean ± SEM. Each dot represents a single mouse. *p ≤ 0.05 between indicated groups. Green: DNA; Red: DNase 1 or BSA. (C) Representative intravital microscopy images of mice 24 h after APAP overdose, showing DNA and F-actin labeling in the liver before and after intravenous (i.v.) DNase 1 injection (40 mg/kg). #p ≤ 0.05 compared to time point 0 for DNA and F-actin. *p ≤ 0.05 between DNA and F-actin at 10 min after DNase injection. Data are represented as mean ± SEM. Green: DNA; Red: F-actin. Quantifications were pooled from 3 fields of view per mouse. APAP, acetaminophen. Scale bars = 50 μm
Fig. 2
Fig. 2
Degradation of extracellular DNA by DNase 1 enhances recovery in drug-induced liver injury. Mice receiving an APAP overdose (600 mg/kg) were sacrificed 24–48 h for analysis. For the 24-hour time point, mice were treated i.v. with either vehicle (PBS) or DNase 1 (40 mg/kg) 6 and 12 h post-overdose. For the 48-hour time point, an additional dose of DNase 1 was administered 24 h after the overdose. For those mice, the following parameters were evaluated at 48 h: (A) Serum alanine aminotransferase (ALT) levels, (B) percentage fibrin(ogen)+ and (C) percentage Ki67+ area in liver cryosections. (D) Representative images showing immunostaining of liver cryosections from APAP-challenged mice treated with vehicle or DNase 1. Green: fibrin(ogen); Red: F-actin. Scale bar = 200 μm. For liver cryosections, quantifications were pooled from 10 fields of view per mouse. (E) Flow cytometry of liver non-parenchymal cells (NPCs) 48 h post-APAP showing the percentage of neutrophils (Ly6G+), (F) classical monocytes (Ly6G/F480/Ly6C+/CCR2+), (G) non-classical monocytes (Ly6G/Ly6C/CX3CR1+) and (H) macrophages (Ly6G/Ly6C/F480+). At 24 h post-APAP, the following parameters were evaluated: (I) Serum nucleosome and (J) serum β-actin levels, (K, L) Cxcl10 and Il10 expression levels in mouse livers, normalized to the average expression of a housekeeping gene (Cdkn1a), and presented as 2−∆∆Ct relative to the control group. Each dot represents a single mouse. Data are represented as mean ± SEM. *p ≤ 0.05 between indicated groups. #p ≤ 0.05 compared to control. C, control; APAP, acetaminophen
Fig. 3
Fig. 3
Spatially-resolved proteomic analysis of necrotic areas after DNase 1 treatment. Mice received an APAP overdose (600 mg/kg), were treated i.v. with either vehicle (PBS, n = 3) or DNase 1 (40 mg/kg, n = 3) at 6 and 12 h post-overdose, and were sacrificed at 24 h. Cryosections were made, and on-tissue microdigestion with trypsin of injured areas was followed by identification using LC-MS/MS. (A) Heatmap of differentially expressed proteins in necrotic areas between mice that were treated with vehicle or DNase 1. LFQ intensities were log2-transformed and median-normalized row-wise, with higher z-scores and thus higher relative abundances for each protein indicated in red. Each row represents a protein, each column is a sample. Comparisons with p ≤ 0.05 were considered significant. Proteins that were detected but not significantly altered between both conditions included DAMPs and proteins of the coagulation, fibrinolytic and complement system. (B) Volcano plot of the differentially expressed proteins, showing the fold change (log2 ratio) plotted against the statistical significance (-log10 of the p-value). Red and green dots in the volcano plot indicate proteins with significant differences (green, p ≤ 0.05, 2-fold decrease; red, p ≤ 0.05, 2-fold increase); gray dots are proteins without significant change. APAP, acetaminophen
Fig. 4
Fig. 4
Charged peptides displace debris in vitro but do not improve outcome in vivo. Western blotting for histone H3 and β-actin in supernatant of HepG2 debris incubated with different concentrations of (A) positively charged PLK and (B) negatively charged PLE, both 20 amino acids long, or buffer (B) alone. A full lysate of HepG2 cells (FL) was loaded at 10 µg as a positive control. Mice that received an APAP overdose (600 mg/kg) were treated i.v. with 400 µg/kg (low dose) or 800 µg/kg (high dose) of the peptides at 6 and 12 h for the 24-hour time point, with an additional dose given at 24 h for the 48-hour time point. (C, D) Serum alanine aminotransferase (ALT) levels following treatment with PLK or PLE. (E) Fibrin(ogen)+ area fraction in liver cryosections. Quantifications for liver cryosections were pooled from 10 fields of view per mouse. Each dot represents a single mouse. Data are represented as mean ± SEM. #p ≤ 0.05 compared to vehicle control. C, control without APAP; APAP, acetaminophen
Fig. 5
Fig. 5
Increasing fibrinolysis worsens outcome after drug-induced liver injury. (A) Representative intravital microscopy images of mice 24 h after APAP overdose (600 mg/kg), showing DNA and F-actin labeling in the liver before and after i.v. tPa injection (5 mg/kg). #p ≤ 0.05 compared to time point 0 for DNA and F-actin. Green: DNA; Red: F-actin. Quantifications were pooled from 3 fields of view per mouse. Scale bar = 50 μm. (B) Mice were treated with vehicle (PBS) or tPa (5 mg/kg) 12 h after receiving an APAP overdose, then sacrificed 24 h post-APAP. Representative images showing immunostaining of liver cryosections from APAP-challenged mice treated with vehicle or tPa. Green: fibrin(ogen); Red: F-actin. Scale bar = 200 μm. Additionally, the following parameters were assessed: (C) Serum alanine aminotransferase (ALT) levels, (D) percentage fibrin(ogen)+ area in liver cryosections, with quantifications pooled from 10 fields of view per mouse, (E) serum β-actin levels and (F, G) Cxcl10 and Il10 expression levels in mouse livers, normalized to the average expression of a housekeeping gene (Cdkn1a), and presented as 2−∆∆Ct relative to the control group. (H) Serum ALT levels in mice treated with heparin i.p. (3000 U/kg) or actin i.v. (800 µg/kg) 6 h after APAP overdose and sacrificed at 24 h. Each dot represents a single mouse. Data are represented as mean ± SEM. *p ≤ 0.05 between indicated groups. #p ≤ 0.05 compared to control. C, control; APAP, acetaminophen

References

    1. Galluzzi L, Vitale I, Aaronson SA et al (2018) Molecular mechanisms of cell death: recommendations of the nomenclature committee on cell death 2018. Cell Death Differ 25:486–541. 10.1038/s41418-017-0012-4 - PMC - PubMed
    1. Schuermans S, Kestens C, Marques PE (2024) Systemic mechanisms of necrotic cell debris clearance. Cell Death Dis 15:557. 10.1038/s41419-024-06947-5 - PMC - PubMed
    1. Lai JJ, Cruz FM, Rock KL (2020) Immune sensing of cell death through recognition of histone sequences by C-Type Lectin-Receptor-2d causes inflammation and tissue injury. Immunity 52:123–135e6. 10.1016/j.immuni.2019.11.013 - PMC - PubMed
    1. Xu J, Zhang X, Monestier M, Esmon NL, Esmon CT (2011) Extracellular histones are mediators of death through TLR2 and TLR4 in mouse fatal liver injury. J Immunol 187:2626–2631. 10.4049/jimmunol.1003930 - PMC - PubMed
    1. Ahrens S, Zelenay S, Sancho D et al (2012) F-actin is an evolutionarily conserved damage-associated molecular pattern recognized by DNGR-1, a receptor for dead cells. Immunity 36:635–645. 10.1016/j.immuni.2012.03.008 - PubMed

LinkOut - more resources