. 2025 Apr 30;10(1):145.
doi: 10.1038/s41392-025-02223-w.

Multipronged SMAD pathway targeting by lipophilic poly(β-amino ester) miR-590-3p nanomiRs inhibits mesenchymal glioblastoma growth and prolongs survival

Affiliations

Multipronged SMAD pathway targeting by lipophilic poly(β-amino ester) miR-590-3p nanomiRs inhibits mesenchymal glioblastoma growth and prolongs survival

Jack Korleski et al. Signal Transduct Target Ther. .

Abstract

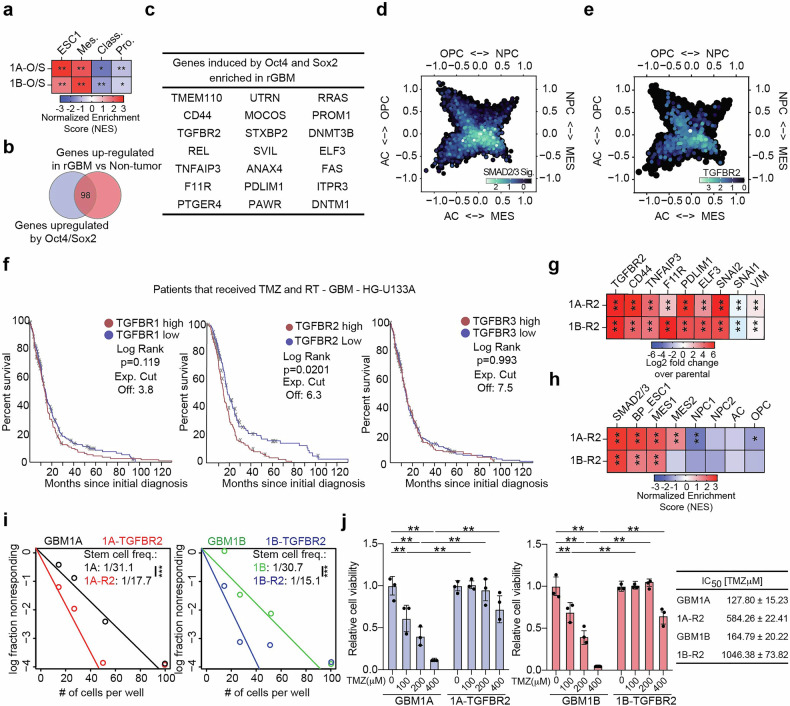
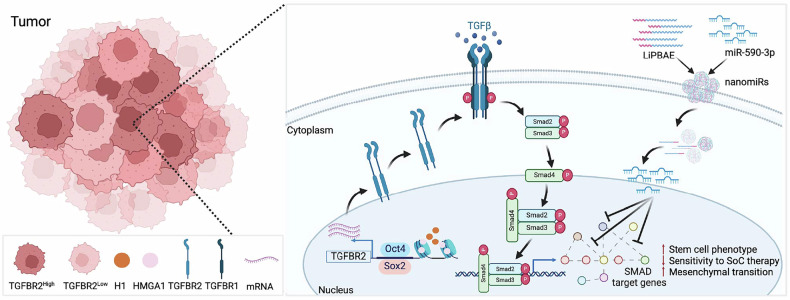
Despite aggressive therapy, glioblastoma (GBM) recurs in almost all patients and treatment options are very limited. Despite our growing understanding of how cellular transitions associate with relapse in GBM, critical gaps remain in our ability to block these molecular changes and treat recurrent disease. In this study we combine computational biology, forward-thinking understanding of miRNA biology and cutting-edge nucleic acid delivery vehicles to advance targeted therapeutics for GBM. Computational analysis of RNA sequencing from clinical GBM specimens identified TGFβ type II receptor (TGFBR2) as a key player in the mesenchymal transition associated with worse outcome in GBM. Mechanistically, we show that elevated levels of TGFBR2 is conducive to reduced temozolomide (TMZ) sensitivity. This effect is, at least partially, induced by stem-cell driving events coordinated by the reprogramming transcription factors Oct4 and Sox2 that lead to open chromatin states. We show that blocking TGFBR2 via molecular and pharmacological approaches decreases stem cell capacity and sensitivity of clinical recurrent GBM (rGBM) isolates to TMZ in vitro. Network analysis uncovered miR-590-3p as a tumor suppressor that simultaneously inhibits multiple oncogenic nodes downstream of TGFBR2. We also developed novel biodegradable lipophilic poly(β-amino ester) nanoparticles (LiPBAEs) for in vivo microRNA (miRNAs) delivery. Following direct intra-tumoral infusion, these nanomiRs efficiently distribute through the tumors. Importantly, miR-590-3p nanomiRs inhibited the growth and extended survival of mice bearing orthotopic human rGBM xenografts, with an apparent 30% cure rate. These results show that miRNA-based targeted therapeutics provide new opportunities to treat rGBM and bypass the resistance to standard of care therapy.


Conflict of interest statement

Competing interests: J.G. and S.T. are managers and co-founders of OncoSwitch. J.G. is a board member, CSO, and co-founder of Cove Therapeutics and a manager, CTO, and co-founder of Dome Therapeutics. Patents related to the technology discussed in the manuscript and any potential conflicts of interest are managed by the Johns Hopkins University Committee on Outside Interests. There are no competing interests from the other authors.

Figures

Fig. 1
Fig. 1
TGFBR2 signaling associates with the therapy-resistant state in GBM. a Heatmap showing normalized enrichment scores (NES) from GSEA of gene signatures GBM subtypes. b Venn diagram showing genes induced by Oct4 and Sox2 in GBM neurospheres and also upregulated in rGBM compared to non-tumor tissue. c Table summarizing statistically significant genes upregulated in GBM neurospheres expressing transgenic Oct4 and Sox2 and rGBM. Two-dimensional butterfly plot visualization of snRNA-Seq data generated from rGBM clinical specimens (5 male and 5 female datasets; GSE174554) based on molecular subtype signature scores determined by Neftel et al. showing (d) SMAD2/3 target gene signatures and (e) TGFBR2 expression. f Kaplan-Meier survival curve of GBM patients with high vs. low TGFBR2 expression that received an aggressive course of therapy. g Heatmap showing expression of selected genes from RNA-Seq performed in GBM neurospheres expressing transgenic TGFBR2. h Heatmap showing normalized enrichment scores (NES) from GSEA of gene signatures associated with the transition to a therapy-resistant state in GBM. i Equal numbers of GBM neurospheres with (1A-R2 or 1B-R2) and without (1A or 1B) transgenic TGFBR2 were seeded under limiting dilution conditions and stem cell frequency was determined after 14 days. j Equal numbers of GBM neurospheres with and without transgenic TGFBR2 were treated with TMZ and cell viability was measured 5 days after treatment via Cell Titer Glo assay. Statistical significance was calculated using unpaired, non-parametric, student T-test with Mann–Whitney post hoc test in panel f; Student T-test was used to determine statistical differences in panels h and i; One-way ANOVA with Tukey’s post hoc test was used to calculate statistical significance in panel j. Data are presented as means±S.D. *p < 0.05; **p < 0.01; ***p < 0.001
Fig. 2
Fig. 2
Changes in chromatin architecture activates TGFBR2 expression in TMZ-insensitive GBM neurospheres. a Schematic showing predicted binding sites for Oct4 (blue) or Sox2 (red) on the TGFBR2 promoter. Red arrows mark the primer sites used for down-stream analysis (top panel). qRT-PCR analysis showing TGFBR2 expression in GSCs expressing transgenic Sox2 or Oct4. GFP was used as a negative control. b DNA purified from chromatin immuno-precipitation was analyzed by qRT-PCR using primer pairs designed to amplify fragments containing Sox2 and Oct4 binding sites shown in (a). c 293 T cells were co-transfected with a luciferase reporter construct spanning the TGFBR2 putative promoter containing the Sox2 and Oct4 binding sites and GFP, Oct4 or Sox2 and luciferase activity was measured 2 days after transfection. d ATAC-Seq tracks showing chromatin accessibility in GSCs with and without transgenic Oct4/Sox2 expression. Grey boxes mark priming sites used for downstream analysis. e DNA purified from chromatin that underwent Tn5 transposition was analyzed by qRT-PCR using primer pairs designed to amplify fragments predicted to reside in euchromatin regions spanning the TGFBR2 promoter. f Schematic showing predicted HMGA1 binding site to the TGFBR2 promotor (top panel) and ChIP-PCR showing architectural transcription factor HMGA1 bind to TGFBR2 promoter. g GBM neurospheres were exposed to 2 Gy of ionizing radiation and 200 μM of TMZ and surviving clones were expanded over several weeks. Equal numbers of naïve (N) and therapy-surviving (R) cells were treated with TMZ and cell viability was measured 5 days after treatment via Cell Titer Glo assay. h qRT-PCR analysis showing expression of TGFBR2, mesenchymal marker CD44, SMAD target genes (SNAI2, F11R, and PDLIM1), stem cell drivers (Oct4, Sox2, Kl4, and Nanog), and DNA repair enzyme MGMT in naïve and therapy-surviving GBM neurosphere pairs. i DNA purified from chromatin that underwent Tn5 transposition in naïve and resistant GBM neurospheres was analyzed by qRT-PCR using primers spanning the TGFBR2 promoter. j DNA purified from chromatin immuno-precipitation in TMZ resistant GBM neurospheres (Mayo 39 R) or rGBM (GBM_120) clinical specimens was analyzed by qRT-PCR using primer pairs designed to amplify fragments containing Sox2 and Oct4 binding sites shown in (a). Student T-test was used to determine statistical differences in panels b, e, f and i; One-way ANOVA with Tukey’s post hoc test was used to calculate statistical significance in panel a, c, g and j. Data are presented as means±S.D. *p < 0.05; **p < 0.01; ***p < 0.001; ****p < 0.0001
Fig. 3
Fig. 3
TGFBR2 inhibition increases sensitivity of GBM neurospheres to TMZ. GBM neurospheres were transduced with 2 independent shRNAs and expression of TGFBR2 was measured after 5 days via western blot (a) or qRT-PCR (b). c Western blot showing expression of TGFBR2 and pSMAD2 48 h after ITD1 treatment in GBM neurospheres. d qRT-PCR analysis showing expression of down-stream TGFβ targets 5 days after ITD1 treatment in GBM neurospheres. e ELDA assay to measure stem cell frequency 14 days after TGFBR2 knock-down in GBM neurospheres. f GBM neurospheres received TMZ (200 μM) 3 days after transduction with lentivirus expressing 2 independent shRNAs against TGFBR2. Cell viability was measured 2 days after TMZ treatment using CTG assay. g ELDA assay to measure stem cell frequency 14 days after ITD1 treatment in GBM neurospheres and clinical rGBM isolates. h Therapy-resistant and clinical rGBM specimens were treated with ITD1 (20 μM), TMZ (200 μM), or the combination and cell viability was measured using CTG assay 5 days after treatment. Student T-test was used to determine statistical differences in panels b and d. One-way ANOVA with Tukey’s post hoc test was used to calculate statistical significance in panel f, h. Data are presented as means±S.D. **p < 0.01; ***p < 0.001
Fig. 4
Fig. 4
miRNA-based targeting of TGFBR2 pathway inhibits the stem cell phenotype rGBM cells. a Network of miRNA and gene targets (left panel), Number of predicted SMAD2/3 targets enriched in rGBM by miRNA (right panel). b Gene expression correlation analysis between TGFBR2 or TGFBR1 and the predicted miR-590-3p targets in rGBM clinical specimens (HG-U133A). Genes highlighted in red show statistically significant positive correlations. c Expression of miR-590-3p in GBM clinical specimens compared to Non-tumor tissue. d Pearson’s correlation coefficient for gene signature composed of miR-590-3p targets with TGFBR1, TGFBR2, TGFBR3 expression and markers or gene signatures related to GBM cell subsets determined from scRNA-Seq derived from GSCs. e Cell viability 5 days after miR-590-3p or ITD1 treatment. f Expression of miR-590-3p predicted targets by qRT-PCR 5 days after transgenic miR-590-3p expression. g ELDA assay measuring stem cell frequency 14 days after transgenic miR-590-3p expression in rGBM cells. Statistical significance was calculated using unpaired, non-parametric, student T-test with Mann–Whitney post hoc test in panel c; Student T-test was used to determine statistical differences in panel f; One-way ANOVA with Tukey’s post hoc test was used to calculate statistical significance in panels d and e. Data are presented as means±S.D. **p < 0.01; ***p < 0.001
Fig. 5
Fig. 5
Novel LiPBAE has low toxicity and effectively delivers miRNAs to rGBM cells in vitro and in vivo. a LiPBAEs were synthesized using structurally diverse monomers. Each LiPBAE is composed of the B7 backbone monomer, a blend of hydrophilic sidechain and lipophilic sidechain monomers (% lipophilic sidechain monomer indicated), and an endcap monomer. Uptake efficacy in rGBM_120 and rGBM_192 cells 24 h following nanomiR administration represented as %Cy3+ cells (b) and Cy3 mean fluorescence intensity (MFI) (c). d Cell viability was assessed via cell titer glo 24 h following nanomiR administration. e PEGylated 7-90,c12-49 80% nanomiRs maintained their small size after up to five days of incubation in PBS or artificial CSF (aCSF). f PEGylated 7–90,c12–49 80% nanomiRs enabled functional delivery of siGFP in vitro following 24 h of incubation in PBS or aCSF. g qRT-PCR analysis showing expression of miR-590-3p targets 5 days after nanomiR transfections in rGBM clinical specimens. h ELDA assay to measure stem cell frequency 14 days after nanomiR transfection in rGBM clinical specimens. i Schematic showing in vivo PEGylated nanomiR delivery using fluorescently-tagged control miRNA (top left panel). H&E-stained section showing established orthotopic rGBM (bottom left panel). Dotted lines outline canula track and boxes mark regions used to capture fluorescence images. Fluorescence imaging showing Cy3 signal within the tumor and in different parts of the brain (bottom right panel). Student T-test was used to determine statistical differences in panel g. Data are presented as means±S.D. **p < 0.01. ***p < 0.001
Fig. 6
Fig. 6
In vivo delivery of PEGylated miR-590-3p nanomiRs inhibits rGBM growth and extends survival in orthotopic rGBM mouse models. a Schematic showing the in vivo delivery of PEGylated miR-590-3p nanomiRs. b H&E-stained brain sections from mice bearing orthotopic rGBM 22 days after receiving PEGylated nanomiRs loaded with control miRNA or miR-590-3p. Dotted line outlines necrotic region. c Viable tumor was measured from H&E-stained sections using computer assisted image analysis. d Spatial transcriptomic analysis identified 3 distinct regions in tumors treated with PEGylated miR-590-3p nanomiRs. e Transcriptomic analysis of miR-590-3p targets in mice that received PEGylated control miRNA or miR-590-3p nanomiRs. Genes highlighted in red are ones that did not decrease with miR-590-3p treatment. f Transcriptomic analysis looking at expression of miR-590-3p targets in mice that received PEGylated miR-590-3p nanomiRs. g GSEA from transcriptomic analysis of tumors treated with PEGylated miR-590-3p nanomiRs looking at gene signatures associated with therapy resistance in GBM in the three distinct regions defined in (d). h Kaplan-Meier survival curve comparing animals that received control miRNA, miR-590-3p or no treatment. Therapy in the survival study was initiated 7 days after tumor cell implantation. Survival was compared across arms using the log-rank test (N = 10). i H&E-stained sections showing the last animal in the control group and the 3 long-term survivors. Statistical significance was calculated using unpaired, non-parametric, student T-test with Mann–Whitney post hoc test in panel c
Fig. 7
Fig. 7
Proposed mechanistic model. GBM cells with high levels of TGFBR2 display enhanced SMAD2/3 signaling. These cells exhibit an accessible chromatin state at the TGFBR2 promoters associated with direct binding of architectural transcription factor HMGA1 and stem cell drivers Oct4 and Sox2. This increase in TGFBR2 levels associates with SMAD2/3 signaling activation, reduced sensitivity to TMZ and increases self-renewal capacity in GBM neurospheres. LiPBAE nanoparticles efficiently deliver miR-590-3p to simultaneously block multiple SMAD2/3 targets, induce tumor regression and prolong animal survival. These findings highlight the therapeutic potential of blocking TGFBR2 signaling in rGBM. Created in BioRender. Lopez-Bertoni, H. (2025) https://BioRender.com/u19d660

References

    1. Zhang, M. et al. TGF-beta signaling and resistance to cancer therapy. Front Cell Dev Biol.9, 786728. - PMC - PubMed
    1. Birch, J. L., et al. Multifaceted transforming growth factor-beta (TGFbeta) signalling in glioblastoma. Cell Signal72, 109638 (2020). - PubMed
    1. Liu, S., Ren, J. & Ten Dijke, P. Targeting TGFbeta signal transduction for cancer therapy. Signal Transduct. Target Ther.6, 8 (2021). - PMC - PubMed
    1. Li, B., Chen, J., Wu, Y., Luo, H. & Ke, Y. Decrease of circARID1A retards glioblastoma invasion by modulating miR-370-3p/ TGFBR2 pathway. Int. J. Biol. Sci.18, 5123–5135 (2022). - PMC - PubMed
    1. Narushima, Y. et al. Integrative network analysis combined with quantitative phosphoproteomics reveals transforming growth factor-beta receptor type-2 (TGFBR2) as a novel regulator of glioblastoma stem cell properties. Mol. Cell Proteom.15, 1017–1031 (2016). - PMC - PubMed

MeSH terms

Grants and funding

LinkOut - more resources