. 2025 Apr 30;16(1):4046.
doi: 10.1038/s41467-025-59182-7.

Epitope-optimized vaccine elicits enduring immunity against swine influenza A virus

Affiliations

Epitope-optimized vaccine elicits enduring immunity against swine influenza A virus

Erika M Petro-Turnquist et al. Nat Commun. .

Abstract

Swine Influenza A Virus (IAV-S) poses a significant burden to both the pork industry and public health. Current vaccines against IAV-S are infrequently updated and induce strain-specific immunity. Computational platforms have recently emerged as a promising strategy to develop new-age vaccines. Here, we describe the Epigraph, a computationally derived and epitope optimized set of vaccine immunogens. When compared to wildtype immunogens (WT) and a commercial comparator (FluSure XP®), pigs immunized with Epigraph demonstrate significantly improved breadth and magnitude of antibody responses. Further, pigs immunized with Epigraph show more robust and a wider breadth of cross-reactive cell-mediated immune responses than pigs immunized with WT immunogens. In an experimental infection model, Epigraph immunized pigs demonstrate a significant reduction of clinical disease, lower shedding of infectious virus, reduction of lung lesions, and lower microscopic immunopathology compared to the other immunization groups. These data support the continued investigation of computationally designed and epitope optimized vaccine immunogens against influenza A virus.


Conflict of interest statement

Competing interests: E.A.W. is an inventor of the Epigraph immunogens in this study and has a patent application in progress (Application: 62/734,791; International Application: PCT/US19/52137). Due to patents and pending applications restrictions apply regarding the public availability of sequence information for the reported immunogens. However, unique biologicals and sequence information can be requested at Nutech Ventures, Lincoln, NE (US) by contacting info@nutechventures.org and will be processed as promptly as possible. All other authors declare no competing interests.

Figures

Fig. 1
Fig. 1. Development and characterization of epitope optimized (Epigraph) vaccine immunogens.
A Phylogenetic characterization of classical swine and human-seasonal swine influenza A virus lineages with localization of Epigraph and WT vaccine immunogens. B Epicover analysis of exact-matched, off-by-1, and off-by-2 epitope coverage in Epigraph, WT, or representative strains in a commercial vaccine. C Immunoblots of Epigraph and WT vaccine expression from infected cell lysates. Data are representative of two independent experiments. D Percent amino acid identity between virus strains used throughout the study and the individual Epigraph or WT vaccine immunogens.
Fig. 2
Fig. 2. Epigraph induces robustly cross-protective immunity in mouse model.
A Schematic representation of study design in mice. Weight loss, peak weight loss, lung viral titers, and survival analysis after a two-dose immunization and experimental infection with B representative α clade (1A.1) IAV-S, A/swine/USA/1976/1931 (n = 5 mice for each group; one-way ANOVA with Tukey’s multiple comparisons), C γ clade (1A.3.3.3) IAV-S, A/swine/Minnesota/9606/2015 (n = 5 mice for each group; one-way ANOVA with Tukey’s multiple comparisons), or D δ1 clade (1B.2.2) IAV-S, A/swine/Arkansas/6312/2012 (n = 5 mice for each group; one-way ANOVA with Tukey’s multiple comparisons). Dashed lines in weight loss curves indicate threshold for ≥25% weight loss. Dashed lines in viral RNA quantification and lung viral titer graphs indicate assay limits of detection. Data are presented as the mean ± SEM. Created in BioRender. Madapong, A. (2025) https://BioRender.com/8dqpzbw.
Fig. 3
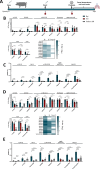
Fig. 3. Epigraph vaccine induces cross-reactive antibody responses against swine, human, and avian IAV in swine model.
A Schematic representation of study design in swine (n = 5 pigs/group). B Hemagglutination inhibition (HI) antibodies after a single immunization against representative IAV-S isolates (top), representative human and avian IAV (bottom, left), and a summary heatmap of antibody responses (bottom, right). Data are presented as the mean ± SEM (n = 5 pigs per group; one-way ANOVA with Tukey’s multiple comparisons). C Serum IgG responses after a single immunization. Data are presented as the mean ± SEM (n = 5 pigs per group; one-way ANOVA with Tukey’s multiple comparisons). D HI antibody responses after a two-dose immunization. Data are presented as the mean ± SEM (n = 5 pigs per group; one-way ANOVA with Tukey’s multiple comparisons). E Serum IgG responses after a two-dose immunization. Data are presented as the mean ± SEM (n = 5 pigs per group; one-way ANOVA with Tukey’s multiple comparisons). Dashed lines in (A) and (D) indicate a 50% protective titer (≥1:40; 5.32 log2). Created in BioRender. Madapong, A. (2025) https://BioRender.com/4jxfaik.
Fig. 4
Fig. 4. Epigraph induces robust T cell responses in swine model.
Total IFN-γ T cell responses (n = 5 pigs/group) after a prime and boost immunization (left) and epitope-specific T cell responses (right) against (A) a classical swine IAV-S isolate, (B) ancestral human IAV isolate, and (C) human H1N1pdm09 IAV isolate. Data in (AC) are presented as the mean ± SEM (n = 5 pigs per group; one-way ANOVA with Tukey’s multiple comparisons). Dashed lines indicate limit of detection at 50 spot forming units (SFU)/106 cells. D Linear schematic representation of epitope responses mapped to regions of the corresponding full-length hemagglutinin protein.
Fig. 5
Fig. 5. Epigraph reduces clinical disease and nasal shedding.
A Rectal temperatures over the course of experimental infection (left) and calculated area under the curve of measured temperatures over time (right). Data are presented as the mean ± SEM (n = 5 pigs per group; one-way ANOVA with Tukey’s multiple comparisons). B Quantification of infectious virus collected from nasal swabs over the course of experimental infection (left) and calculated area under the curve of infectious virus over time (right). (n = 5 pigs per group; one-way ANOVA with Tukey’s multiple comparisons). Dashed line in (A) indicates fever in swine. Dashed line in (B) indicates assay limit of detection.
Fig. 6
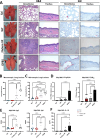
Fig. 6. Protective effect of Epigraph vaccine against lung pathology and viral replication after challenge in swine.
A Representative image of lungs from each vaccination group. Arrows show red-purple consolidation consistent with influenza infection (left); hematoxylin and eosin staining showing differential cellularization in bronchioles and trachea samples (middle, left); immunohistochemistry targeting conserved influenza A virus nucleoprotein in bronchioles and trachea samples (middle, right). Bronchiole H&E images are shown at 10x (Scale bar: 120 µm), trachea H&E images are shown at 20x (Scale bar: 60 µm). IHC images are shown at 20x (Scale bar: 60 µm). B Quantification of macroscopic lung lesions shown in A (n = 5 pigs per group; one-way ANOVA with Tukey’s multiple comparisons). C Quantification of differential cellularization shown in (A) (n = 5 pigs per group; one-way ANOVA with Tukey’s multiple comparisons). D Quantification of viral RNA by RT-qPCR (left) and quantification of infectious virus by TCID50 (right) in bronchioalveolar lavage (BAL) 5 days after experimental infection (n = 5 pigs per group; one-way ANOVA with Tukey’s multiple comparisons). E IgG (left) and IgA levels (right) against challenge strain, A/swine/Minnesota/A01489606/2015, in BAL 5 days after experimental infection (n = 5 pigs per group; one-way ANOVA with Tukey’s multiple comparisons). F Levels of immunosuppressive cytokine, IL-10, present in the BAL 5 days after infection (n = 5 pigs per group; one-way ANOVA with Tukey’s multiple comparisons).
Fig. 7
Fig. 7. Epigraph provides rapid and durable antibody responses in swine.
A Schematic representation of immunization and sampling schedule for longitudinal study. HI antibody responses over the full six-month sampling duration against representative IAV-S from (B, C) α clade (1A.1), (D, E) β clade (1A.2), (F, G) γ clade (1A.3.3.3), (H) δ1 clade (1B.2.2), and (I, J) npdm clade (1A.3.3.2). HI antibody responses against (K, L) human H1N1pdm09 IAV and (M) a representative avian H1 (1A.1-like) IAV. Data in (BM) are presented as the mean ± SEM (n = 5 pigs per group per timepoint; one-way ANOVA with Tukey’s multiple comparison). Dashed lines indicate a 50% protective titer (≥1:40; 5.32 log2). A table of the statistical analysis between groups at each timepoint is available in Supplementary Fig. 4. Created in BioRender. Madapong, A. (2025) https://BioRender.com/p8fljxn.

References

    1. Coates, B. M., Staricha, K. L., Wiese, K. M. & Ridge, K. M. Influenza A Virus Infection, Innate Immunity, and Childhood. JAMA Pediatr.169, 956–963 (2015). - PMC - PubMed
    1. Petrova, V. N. & Russell, C. A. The evolution of seasonal influenza viruses. Nat. Rev. Microbiol.16, 47–60 (2018). - PubMed
    1. Roberts, N. J., Jr. & Krilov, L. R. The Continued Threat of Influenza A Viruses. Viruses14, 10.3390/v14050883 (2022). - PMC - PubMed
    1. Heaton, N. S., Sachs, D., Chen, C. J., Hai, R. & Palese, P. Genome-wide mutagenesis of influenza virus reveals unique plasticity of the hemagglutinin and NS1 proteins. Proc. Natl Acad. Sci. USA110, 20248–20253 (2013). - PMC - PubMed
    1. Vincent, A. et al. Review of influenza A virus in swine worldwide: a call for increased surveillance and research. Zoonoses Public Health61, 4–17 (2014). - PubMed

MeSH terms

LinkOut - more resources