. 2025 Apr 29;11(1):210.
doi: 10.1038/s41420-025-02462-4.

Acetylated KIAA1429 by TIP60 facilitates metastasis and immune evasion of hepatocellular carcinoma via N6-methyladenosine-KDM5B-mediated regulation of FoxO1

Affiliations

Acetylated KIAA1429 by TIP60 facilitates metastasis and immune evasion of hepatocellular carcinoma via N6-methyladenosine-KDM5B-mediated regulation of FoxO1

Hu Quan et al. Cell Death Discov. .

Abstract

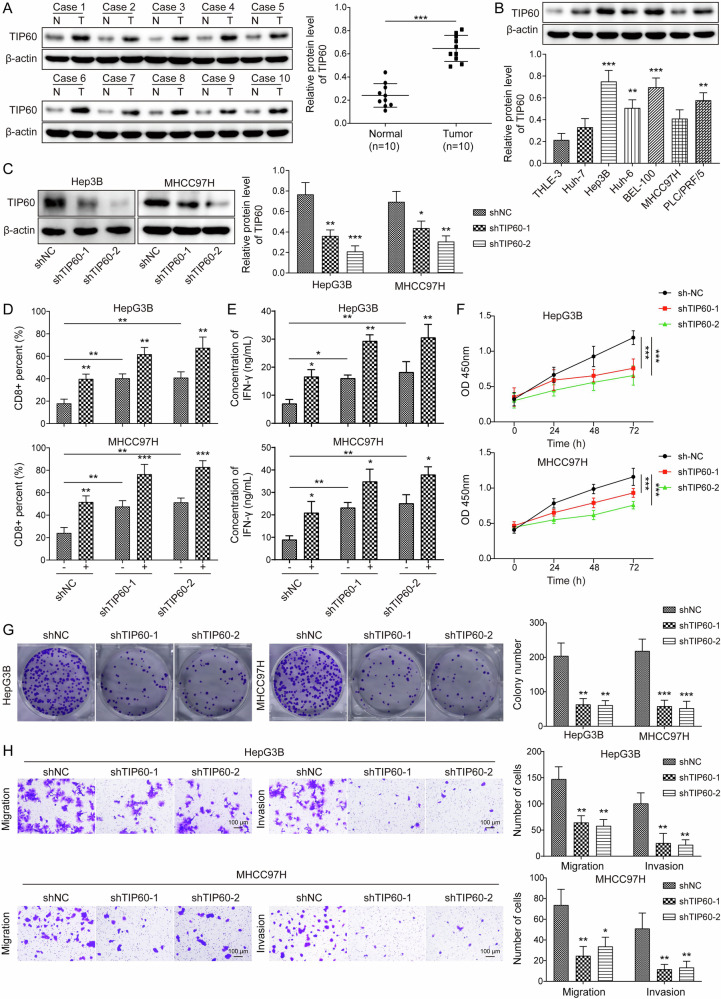
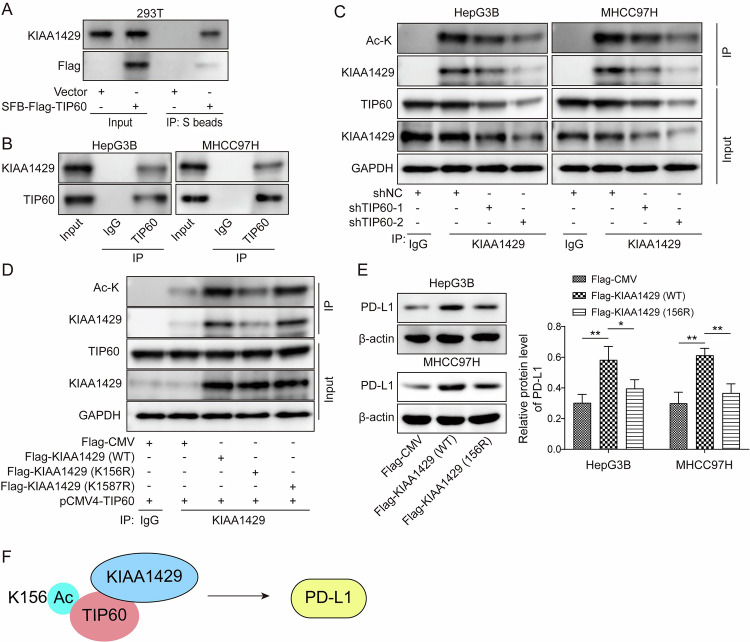
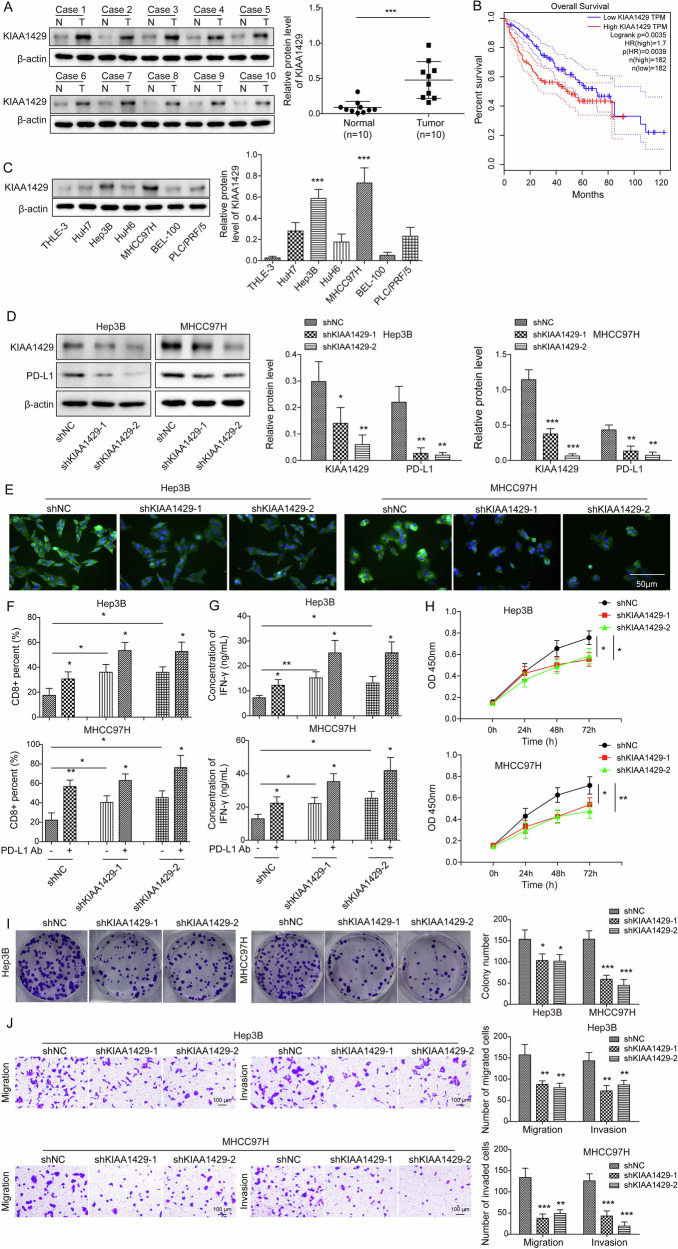
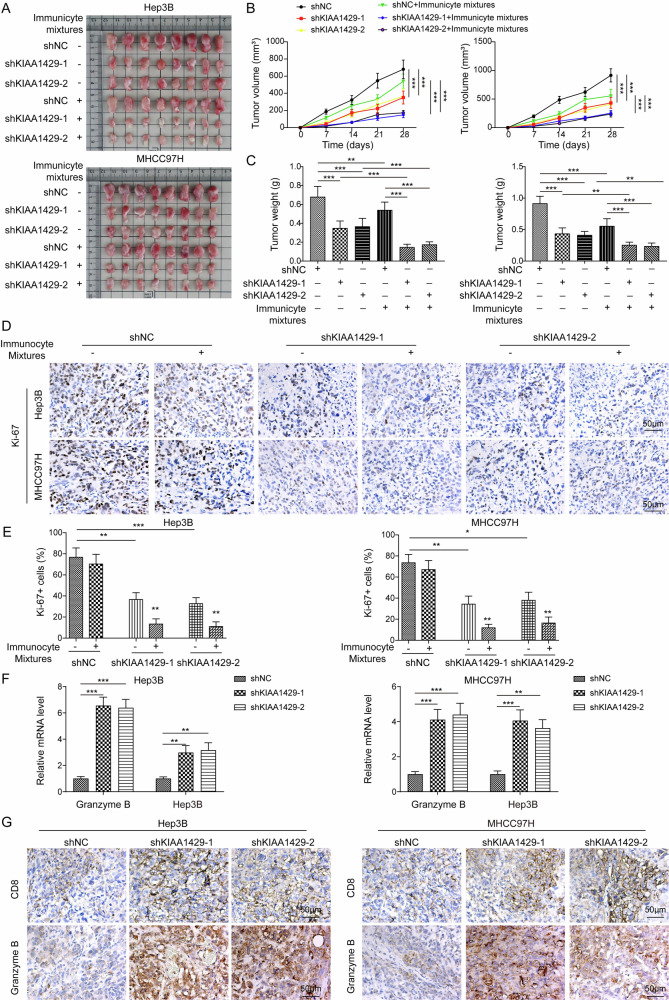
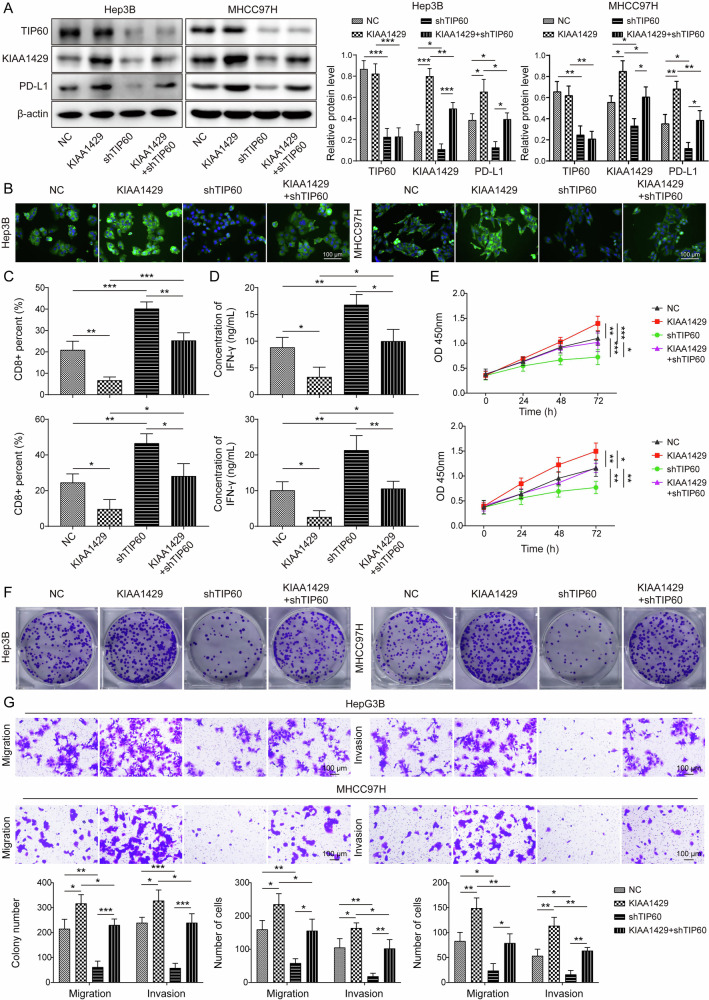
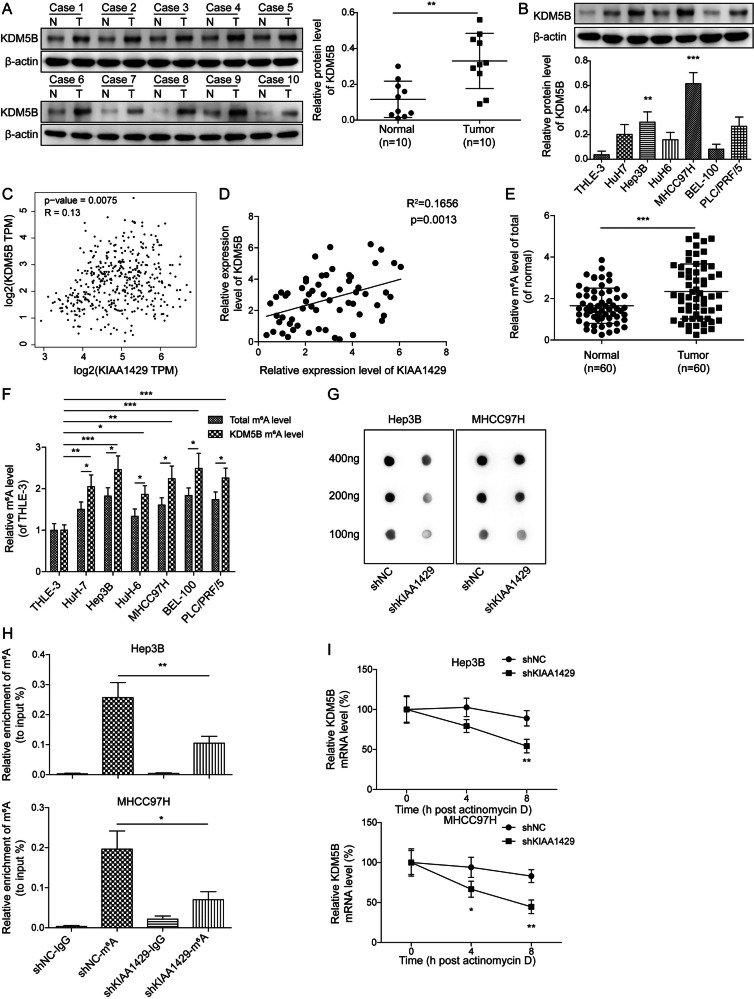
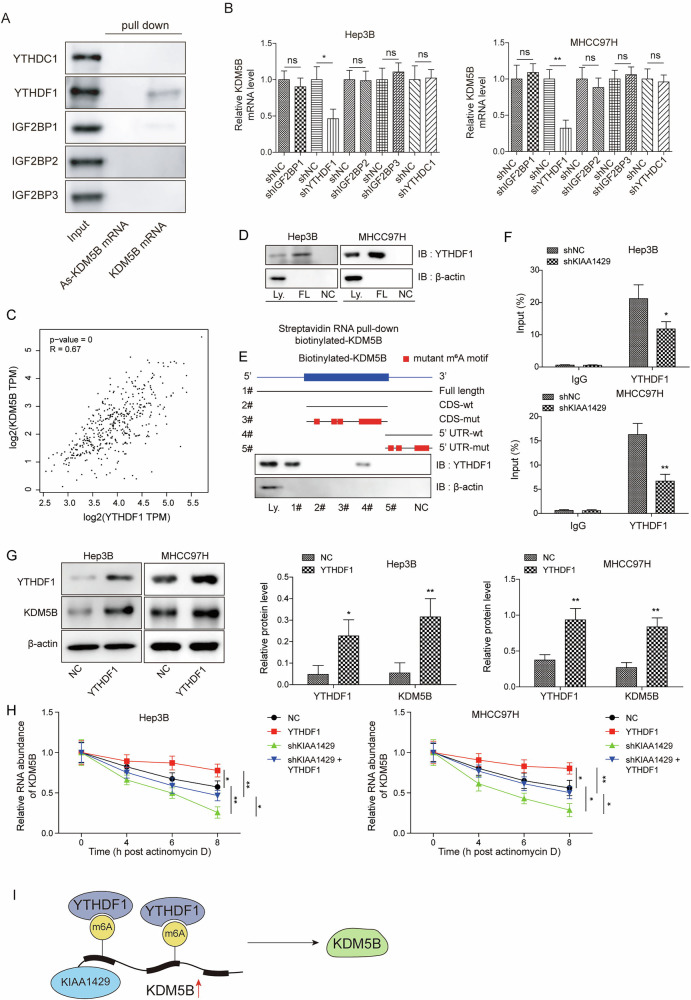
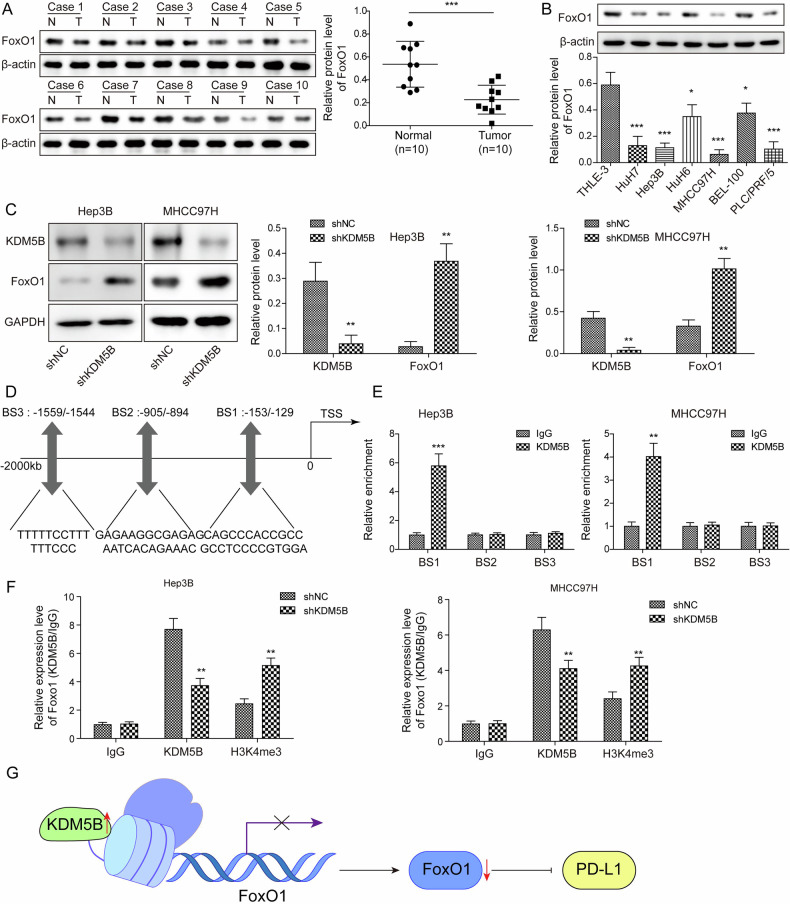
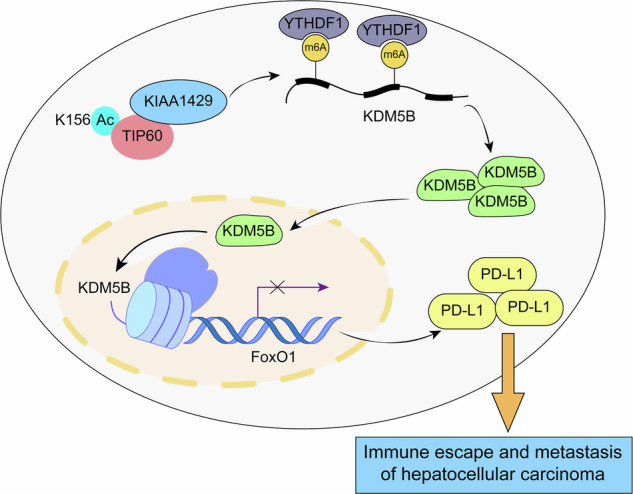
Hepatocellular carcinoma (HCC) is characterized by programmed cell death ligand-1 (PD-L1)-mediated immune escape. This study aimed to elucidate the function and mechanism behind KIAA1429, a component of N6-methyladenosine (m6A) complex, in immune escape of HCC. PD-L1 expression was assessed through immunofluorescence staining, and flow cytometry was used to determine CD8+ T cell percentage. The level of IFN-γ was detected using enzyme-linked immunosorbent assay. Cell proliferation, migration, and invasion were evaluated through CCK-8, colony formation, and Transwell assays, respectively. The m6A modification level was measured using an RNA methylation quantification assay, m6A dot blot, and methylated RNA immunoprecipitation-qPCR. Molecule interaction was validated using RNA pulldown, RNA immunoprecipitation, chromatin immunoprecipitation, and co-immunoprecipitation assays. In vivo HCC growth was evaluated in NOD/SCID mice. We found that TIP60, KIAA1429 and KDM5B were highly expressed in HCC cells, while FoxO1 was poorly expressed. Functionally, TIP60/KIAA1429 silencing inhibited PD-L1-mediated HCC immune evasion, growth, migration, and invasion. Mechanistically, TIP60 led to acetylation of KIAA1429, which promoted KDM5B expression in an m6A-YTHDF1-dependent manner, and subsequently restrained the transcription and expression of FoxO1. Enforcing YTHDF1 expression or depleting FoxO1 expression markedly reversed the suppressive effect of shKIAA1429 on HCC immune evasion, growth, migration, and invasion. Overall, these findings suggest that acetylated KIAA1429-mediated m6A modification endows HCC cells with immune evasion through regulation of KDM5B/FoxO1 axis, which provide a treatment option for HCC by targeting KIAA1429.


Conflict of interest statement

Competing interests: The authors declare no competing interests.

Figures

Fig. 1
Fig. 1. Up-regulation of TIP60 contributed to immune evasion of HCC cells.
A Western blotting analysis of TIP60 expression in HCC specimens and paired para-tumor tissues (N = 10). B TIP60 level in multiple HCC cell lines and normal THLE-3 cells was evaluated by western blotting. C Hep3B and MHCC97H cells were transfected with shNC or shTIP60-1/-2. Western blotting analysis of TIP60 expression after transfection for 48 h. D Flow cytometry assessed the percentage of CD8+ T cells in PBMCs co-cultured with HCC cells transfected with shNC or shTIP60-1/-2. E ELISA analyzed IFN-γ level in the co-culture of HCC cells transfected with shNC or shTIP60-1/-2 and PBMCs. F CCK-8 and (G) colony formation assay evaluated the growth of HCC cells transfected with shNC or shTIP60-1/-2. H Transwell assay measured the invasion and migration of HCC cells transfected with shNC or shTIP60-1/-2 (Scale bar = 100 μm). All experiments were repeated at least 3 times. Data are presented as the mean ± SD. Statistical significance was determined by Student’s t test (for A) or one-way ANOVA (for B-H). *p < 0.05, **p < 0.01, ***p < 0.001.
Fig. 2
Fig. 2. KIAA1429 was acetylated by TIP60 at K156.
A The exogenous interplay between TIP60 and KIAA1429 proteins was validated by Co-IP. 293 T cells were transfected with vector or SFB-Flag-TIP60, followed by Co-IP and western blotting detection. B The endogenous interaction between TIP60 and KIAA1429 proteins was validated by Co-IP. C Hep3B and MHCC97H cells were transfected with shNC or shTIP60-1/-2, and the acetylation level of KIAA1429 in HCC cells was detected by Co-IP. D 293 T cells were transfected with TIP60 plasmid together with KIAA1429-WT, KIAA1429-K156R, or KIAA1429-K1587R; Co-IP determined the acetylation level of KIAA1429. E Western blotting analysis of PD-L1 expression in HCC cells after transfection with Flag-CMV, KIAA1429-WT or KIAA1429-K156R. F A flow chart of the results. All experiments were repeated at least 3 times. Data are presented as the mean ± SD. Statistical significance was determined by one-way ANOVA. *p < 0.05, **p < 0.01.
Fig. 3
Fig. 3. High expression of KIAA1429 led to HCC cell immune evasion.
A KIAA1429 expression in HCC specimens and paired para-tumor tissues was detected by western blotting (N = 10). B TCGA database analysis of the correlation between KIAA1429 expression and survival of HCC patients. C KIAA1429 levels in various HCC cell lines and normal THLE-3 cells were evaluated by western blotting. D Hep3B and MHCC97H cells were transfected with shNC or shKIAA1429-1/-2.Western blotting analysis of KIAA1429 and PD-L1 expression after transfection for 48 h. E Immunofluorescence staining of PD-L1 (green) in Hep3B and MHCC97H cells after transfection with shNC or shKIAA1429-1/-2 (Scale bar = 50 µm). F Flow cytometry analysis of the proportion of CD8+ T cells in PBMCs co-cultured with HCC cells transfected with shNC or shKIAA1429-1/-2. G ELISA assessment of IFN-γ level in the co-culture of HCC cells transfected with shNC or shKIAA1429-1/-2 and PBMCs. H CCK-8 and (I) colony formation assay determined the growth of HCC cells transfected with shNC or shKIAA1429-1/-2. J Transwell assay detection of invasion and migration of HCC cells transfected with shNC or shKIAA1429-1/-2 (Scale bar = 100 μm). All experiments were repeated at least 3 times. Data are presented as the mean ± SD. Statistical significance was determined by Student’s t-test (for A) or one-way ANOVA (for C-J). *p < 0.05, **p < 0.01, ***p < 0.001.
Fig. 4
Fig. 4. KIAA1429 knockdown restrained immune evasion and delayed HCC progression in vivo.
NOD/SCID mice were subcutaneously injected with 2 × 106 HCC cells infected with adenovirus-shNC or -shKIAA1429-1/-2. When the tumor volume was >100 mm3, the mice were injected with PBMCs (5 × 106 /per mouse) combined activated T lymphocytes (1 × 107 /per mouse) via tail intravenous once a week for three times. The growth of xenografts was monitored over 4 weeks. AC Tumor images, tumor volume, and tumor weight were shown. D Immunohistochemistry staining analysis of Ki67 expression in tumor tissues (Scale bar = 50 µm). E Statistic analysis of percentage of Ki67 positive cells in tumor sections. F Granzyme B and IFN-γ expression in tumors was evaluated by RT-qPCR. G Immunohistochemistry staining analysis of granzyme B and CD8 expression in tumor tissues (Scale bar = 50 µm). N = 6. Data are presented as the mean ± SD. Statistical significance was determined by one-way ANOVA. *p < 0.05, **p < 0.01, ***p < 0.001.
Fig. 5
Fig. 5. TIP60 promoted HCC cell immune evasion via KIAA1429 acetylation. Hep3B and MHCC97H cells were transfected with shTIP60, KIAA1429 plasmid, or a combination of them.
A Western blotting analysis of TIP60, KIAA1429, and PD-L1 expression in HCC cells. B Immunofluorescence staining of PD-L1 expression (green) in Hep3B and MHCC97H cells after transfection (Scale bar = 50 µm). C Flow cytometry analysis of the proportion of CD8+ T cells in PBMCs co-cultured with HCC cells with various transfections. D ELISA measured IFN-γ level in the co-culture of HCC cells with various transfections and PBMCs. E CCK-8 and (F) colony formation assay determined the growth of HCC cells after various transfections. G HCC cell invasion and migration were detected by Transwell assay (Scale bar = 100 μm). All experiments were repeated at least 3 times. Data are presented as the mean ± SD. Statistical significance was determined by one-way ANOVA. *p < 0.05, **p < 0.01, ***p < 0.001.
Fig. 6
Fig. 6. KIAA1429 enhanced KDM5B expression via m6A modification.
A Western blotting analysis of KDM5B expression in HCC specimens and paired para-tumor tissues (N = 10). B KDM5B level in multiple HCC cell lines and normal THLE-3 cells was assessed by western blotting. C, D Correlation analysis of KIAA1429 and KDM5B expression in TCGA database and HCC samples. E Total m6A level in HCC samples and normal controls was determined via an RNA methylation quantification assay (N = 60). F Total and KDM5B m6A levels in HCC cells were assessed via RNA methylation quantification assay and MeRIP-qPCR, respectively. G Hep3B and MHCC97H cells were transfected with shNC or shKIAA1429 for 48 h. The m6A level in HCC cells was detected via an m6A dot blot. H MeRIP-qPCR analysis of the KDM5B m6A level in HCC cells transfected with shNC or shKIAA1429 for 48 h. I The stability of KDM5B mRNA in HCC cells transfected with shNC or shKIAA1429 was assessed after exposure to actinomycin D for 4, 8 h. All experiments were repeated at least 3 times. Data are presented as the mean ± SD. Statistical significance was determined by Student’s t-test (for A, E, H, I) or one-way ANOVA (for B, F). *p < 0.05, **p < 0.01, ***p < 0.001.
Fig. 7
Fig. 7. KIAA1429 promoted KDM5B expression in an m6A-YTHDF1-dependent manner.
A RNA pulldown evaluated the binding of YTHDC1, YTHDF1, and IGF2BP1-3 to KDM5B. B Hep3B and MHCC97H cells were transfected with shNC, shYTHDC1, shYTHDF1, or shIGF2BP1-3 for 48 h. KDM5B expression in HCC cells was assessed by RT-qPCR after transfection. C Correlation analysis of YTHDF1 and KDM5B expression according to TCGA data. D, E Western blotting analysis of YTHDF1 after RNA pulldown. F RIP assay validation of the direct binding between the YTHDF1 and KDM5B mRNA. (G) Western blotting analysis of YTHDF1 and KDM5B levels in Hep3B and MHCC97H cells transfected with vector or YTHDF1 plasmid for 48 h. H KDM5B mRNA stability was assessed in Hep3B and MHCC97H cells transfected with vector, YTHDF1 plasmid, shKIAA1429, or YTHDF1 plasmid plus shKIAA1429 after exposure to actinomycin D for 4, 6, 8 h. I A flow chart of the results. All experiments were repeated at least 3 times. Data are presented as the mean ± SD. Statistical significance was determined by Student’s t-test (for B, F, G) or one-way ANOVA (for H). *p < 0.05, **p < 0.01, ***p < 0.001.
Fig. 8
Fig. 8. KDM5B caused transcriptional inhibition of FoxO1.
A Western blotting analysis of FoxO1 expression in HCC specimens and paired para-tumor tissues (N = 10). B FoxO1 levels in HCC cells and normal THLE-3 cells were measured by western blotting. C Hep3B and MHCC97H cells were transfected with shNC or shKDM5B for 48 h. KDM5B and FoxO1 levels in HCC cells were assessed via western blotting. D AnimalTFDB4.0 database predicted the binding sites of KDM5B in the FoxO1 promoter. E ChIP assay validated the binding of KDM5B to the FoxO1 promoter. F The direct binding of KDM5B/H3K4me3 to the FoxO1 promoter in Hep3B and MHCC97H cells transfected with shNC or shKDM5B was assessed via ChIP. G A flow chart of the results. All experiments were repeated at least 3 times. Data are presented as the mean ± SD. Statistical significance was determined by Student’s t-test (for A, C, E, F) or one-way ANOVA (for B). *p < 0.05, **p < 0.01, ***p < 0.001.
Fig. 9
Fig. 9
Mechanism diagram: TIP60-mediated acetylation of KIAA1429 enhanced KDM5B expression through m6A modification, which subsequently restrained transcription of FoxO1, thus favoring immune evasion, growth, migration, and invasion of HCC cells.

Similar articles

References

    1. Bray F, Ferlay J, Soerjomataram I, Siegel RL, Torre LA, Jemal A. Global cancer statistics 2018: GLOBOCAN estimates of incidence and mortality worldwide for 36 cancers in 185 countries. CA Cancer J Clin. 2018;68:394–424. - PubMed
    1. Siegel RL, Miller KD, Jemal A. Cancer statistics, 2020. CA Cancer J Clin. 2020;70:7–30. - PubMed
    1. Okazaki T, Honjo T. PD-1 and PD-1 ligands: from discovery to clinical application. Int Immunol. 2007;19:813–24. - PubMed
    1. Zou Y, Ye F, Kong Y, Hu X, Deng X, Xie J, et al. The Single-Cell Landscape of Intratumoral Heterogeneity and The Immunosuppressive Microenvironment in Liver and Brain Metastases of Breast Cancer. Adv Sci (Weinh). 2023;10:e2203699. - PMC - PubMed
    1. Nakano S, Eso Y, Okada H, Takai A, Takahashi K, Seno H. Recent Advances in Immunotherapy for Hepatocellular Carcinoma. Cancers (Basel). 2020;12:775. - PMC - PubMed

LinkOut - more resources