. 2025 Apr 29;16(1):4024.
doi: 10.1038/s41467-025-59165-8.

Autophagy disruption and mitochondrial stress precede photoreceptor necroptosis in multiple mouse models of inherited retinal disorders

Affiliations

Autophagy disruption and mitochondrial stress precede photoreceptor necroptosis in multiple mouse models of inherited retinal disorders

Fay Newton et al. Nat Commun. .

Abstract

Inherited retinal diseases (IRDs) are a leading cause of blindness worldwide. One of the greatest barriers to developing treatments for IRDs is the heterogeneity of these disorders, with causative mutations identified in over 280 genes. It is therefore a priority to find therapies applicable to a broad range of genetic causes. To do so requires a greater understanding of the common or overlapping molecular pathways that lead to photoreceptor death in IRDs and the molecular processes through which they converge. Here, we characterise the contribution of different cell death mechanisms to photoreceptor degeneration and loss throughout disease progression in humanised mouse models of IRDs. Using single-cell transcriptomics, we identify common transcriptional signatures in degenerating photoreceptors. Further, we show that in genetically and functionally distinct IRD models, common early defects in autophagy and mitochondrial damage exist, triggering photoreceptor cell death by necroptosis in later disease stages. These results suggest that, regardless of the underlying genetic cause, these pathways likely contribute to cell death in IRDs. These insights provide potential therapeutic targets for novel, gene-agnostic treatments for IRDs applicable to the majority of patients.


Conflict of interest statement

Competing interests: The authors declare no competing interests.

Figures

Fig. 1
Fig. 1. Single-cell transcriptomics identifies photoreceptor populations with reduced phototransduction gene expression and increased PI3K/AKT pathway gene expression.
a Subclusters of rod photoreceptors numbered by Seurat according to cluster size (number of cells in each cluster; left panel). Pseudotime analysis of these clusters shows photoreceptor disease trajectory (right panel). b Genes required for phototransduction are downregulated along this trajectory (combined mutant and wild type cells). c, d Genes associated with PI3K/AKT signalling are upregulated in late (more degenerated) clusters compared to early (less degenerated) clusters. This downregulation is more pronounced in RpgrORFd5 (c) and RpgrEx3d8 (d) mutant photoreceptors compared to wild type. e, f Active pAKT is increased in RpgrEx3d8 mutants relative to total AKT at 12 months (bars show mean; n = 4 mice per experimental group; error bars show SEM; *p = 0.037 by unpaired t-test). Source data are provided as a Source Data file. g Mass spectrometry analysis of RpgrEx3d8 retina lysate compared to WT at 6 months (data from Megaw et al., 2024). Red dotted line indicates p < 0.05, grey dotted lines indicate Log2 fold change < −0.6 and >0.6. PTEN, mTOR and LAMP2 highlighted by yellow circles, proteins associated with cell stress pathways are highlighted in cyan (listed in Supplementary Table 5). Other proteins with significant fold change (Log2 fold change < −0.6 or >0.6, p < 0.05) are highlighted in blue.
Fig. 2
Fig. 2. Rpgr mutant photoreceptors accumulate autophagosomes in inner segments.
a, b Changes in autophagy gene expression in RpgrORFd5 (a) and RpgrEx3d8 mutant (b) rod photoreceptors compared to wild type in scRNAseq data. c Transmission electron microscopy images of RpgrEx3d8 and wild-type littermate control photoreceptor inner segments at 6 and 12 months of age show accumulation of autophagosomes in RpgrEx3d8 mutant photoreceptors (magenta arrowheads = outer segments, cyan arrowheads = inner segments, yellow arrows and yellow boxed region indicate autophagosomes, yellow boxed region enlarged in ci, scale bar = 500 nm). d Quantification of autophagosome numbers per inner segment. Colours indicate autophagosome counts per photoreceptor from individual mice, with mean values for each mouse superimposed in black (n = 3 animals per genotype) error bars show SEM; for each time point, means for individual mutant and wild type animals were compared by unpaired t-tests *p = 0.039 (6 months), p = 0.041 (12 months). Source data are provided as a Source Data file.
Fig. 3
Fig. 3. Autophagosome and lysosome markers accumulate in Rpgr mutant photoreceptor inner segments.
a Accumulation of p62 in RpgrEx3d8 photoreceptor inner segments at 12 months (scale bar = 10 μm). b Quantification of p62 puncta in photoreceptor inner segment (n = 3 animals per genotype; symbols indicate sections measured from the same animal, means for each animal overlaid in black circles; error bars show SEM; for each time point, means for individual mutant and wild type animals were compared by unpaired t-tests *p = 0.043). c, d Levels of p62 protein are also increased in RpgrEx3d8 whole retina lysates compared to wild type at 12 months (bars show mean; n = 4 mice per experimental group; error bars show SEM; *p = 0.006 by unpaired t-test). Levels of autophagy-activating S403 phosphorylation are also increased in mutants (c, e) (bars show mean; N = 4 mice per experimental group; error bars show SEM; **p = 0.002). f Accumulation of LAMP1 in RpgrEx3d8 photoreceptor inner segments at 12 months (scale bar = 10 μm). g Quantification of LAMP1 puncta in inner segment (n = 3 animals per genotype, means for each animal overlaid in black circles; error bars show SEM; for each time point, means for individual mutant and wild type animals were compared by unpaired t-tests *p = 0.043). Source data are provided as a Source Data file.
Fig. 4
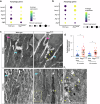
Fig. 4. Rpgr-mutant photoreceptors have abnormal mitochondrial morphology, indicative of mitochondrial damage.
a, b Transmission electron microscopy images of mutant and wild-type photoreceptor inner segments at 12 months (a) and 18 months (b) show mitochondrial swelling (yellow arrowheads) and blebbing of mitochondrial membranes (magenta arrowheads) at 12 months in mutant retina (n = 3 animals for each genotype at each time point). Boxed regions enlarged in lower panels (scale bar = 500 nm). c, d Increased expression of genes required for mitochondrial function in RpgrEx3d8(c) and RpgrORFd5 (d) mutant photoreceptors in scRNAseq data.
Fig. 5
Fig. 5. Mitochondrial stress develops in Rpgr mutant photoreceptors.
a, b VDAC1 expression is increased in mutant photoreceptor inner segments at 12 (a) and 18 (b) months compared to wild-type littermate controls (scale bar = 25 μm. c Quantification of VDAC1 puncta at 12 and 18 months (N = 5 animals per genotype, except wild type at 18 months where n = 3 animals); error bars show SEM; *p = 0.01 (12 months), p = 0.039 (18 months) by unpaired t-test). d Mitochondrial stress assay shows basal oxygen consumption rate (OCR) is reduced in RpgrEx3d8 mutants at 14 months. Mean OCR for 4 biological replicates (n = 4 animals per genotype; 10 biopsies per animal) is shown at each time point (error bars show SD). Vertical lines indicate points of addition of relevant modulators (oligo oligomycin, FCCP carbonyl cyanide p-trifluoro-methoxyphenyl hydrazone; R/AA rotenone + antimycin A). e Mean OCR of mutant retina (time point 3 = Basal, time point 7 = Max) normalised to the mean OCR of wild-type littermate controls at the same time point (error bars show SD; **p = 0.009 by t-test). Source data are provided as a Source Data file.
Fig. 6
Fig. 6. Photoreceptors die by necroptosis in Rpgr mutants.
a, b Necroptosis genes have increased expression in RpgrORFd5 (a) and RpgrEx3d8 (b) mutant rod photoreceptors in scRNAseq. c Increased pMLKL positive photoreceptors in RpgrEx3d8 mutants at 6, 12 and 18 months compared to wild-type littermate controls (all scale bars = 25 μm). d Quantification of pMLKL positive photoreceptors per mm2 in each retina section (symbols indicate images from individual mice, means for each animal overlaid in black circles (n = 3 animals per genotype); bars show mean; error bars show SEM; for each time point, means for individual mutant and wild type animals were compared by unpaired t-tests with Welch’s correction *p = 0.041; **p = 0.005 (12 months), p = 0.007 (18 months). Means for each animal were compared across time points by 2-way ANOVA**p = 0.003 (6 versus 12 months); ****p = 7.63E−7 (12 vs 18 months)). Source data are provided as a Source Data file.
Fig. 7
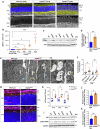
Fig. 7. Necroptosis and autophagy dysregulation are important cell death mechanisms in the Pde6batrd2 mouse model of RP.
a Increased numbers of pMLKL positive photoreceptors were observed in Pde6batrd2 mutants (scale bar = 25 μm). b Quantification of pMLKL positive photoreceptors per mm2 in each retinal section. Wild type combines counts from P14 and P28 retinas from different mice (n = 8 animals in total). All other data points are from individual mice (P14 and P28: n = 4 animals per time point; P16 and P18: n = 3 animals per time point; bars show mean, error bars show SEM; multiple comparisons by 2-way ANOVA *p = 0.027; ***p = 0.0006). c, d Increased level of active pAKT relative to total AKT in retina lysates at P16 (n = 3 wild type and n = 4 mutant animals; bars indicate mean; error bars show SEM; **p = 0.004 by t-test). e Transmission electron microscopy images of wild-type and mutant photoreceptors at P13 showing accumulating autophagosomes in mutants (scale bars = 500 nm; magenta arrowhead indicates outer segment; cyan arrowhead indicates inner segment; yellow arrows indicate autophagosomes; region highlighted in yellow box is enlarged in ei). f Quantification of autophagosomes per inner segment at P13 and P18 (colours indicate counts from individual mice n = 3 animals for each genotype at each time point, means for each animal overlaid in black; error bars indicate SEM; for each time point, means for individual mutant and wild type animals were compared by unpaired t-tests *p = 0.034, **p = 0.007). g Accumulation of p62 in Pde6batrd2 photoreceptor inner segments at P14 and P16 (scale bar = 10 μm). h Quantification of p62 puncta in inner segment. (Symbols indicate counts from individual mice; n = 3 animals per genotype at each time point; error bars show SEM; for each time point, means for individual mutant and wild type animals were compared by unpaired t-tests *p = 0.026 (P14), p = 0.015 (P16)). ik p62 and p-p62 (S403) levels are increased in mutant retina lysates at P16 (bars indicate the mean; n = 3 mice per genotype; error bars show SEM; *p = 0.04, **P = 0.009 by unpaired t-test). Source data are provided as a Source Data file.
Fig. 8
Fig. 8. Mitochondrial stress develops in Pde6batrd2mutant photoreceptors.
a Transmission electron microscopy images of mutant and wild-type photoreceptor inner segments show mitochondrial swelling in Pde6batrd2 mutant photoreceptors (yellow arrowheads) at P13 and P18. Large autophagosomes are also present in Pde6batrd2 photoreceptor inner segments at P13 (magenta arrowheads) (yellow boxed regions enlarged in right-hand panels; scale bars = 500 nm). b VDAC1 expression is increased in mutant photoreceptor inner segments at P14 compared to wild-type littermate controls (scale bar = 25 μm). c Quantification of VDAC1 puncta at P14 (n = 3 wild type animals and n = 4 mutant animals); error bars show SEM; *p = 0.048 by unpaired t-test. Source data are provided as a Source Data file.

Similar articles

References

    1. Hanany, M., Rivolta, C. & Sharon, D. Worldwide carrier frequency and genetic prevalence of autosomal recessive inherited retinal diseases. Proc. Natl Acad. Sci. USA117, 2710–2716 (2020). - PMC - PubMed
    1. Wright, A. F., Chakarova, C. F., Abd El-Aziz, M. M. & Bhattacharya, S. S. Photoreceptor degeneration: genetic and mechanistic dissection of a complex trait. Nat. Rev. Genet.11, 273–284 (2010). - PubMed
    1. Sahel, J.-A., Marazova, K. & Audo, I. Clinical characteristics and current therapies for inherited retinal degenerations. Cold Spring Harb. Perspect. Med. 5, a017111 (2014). - PMC - PubMed
    1. RetNet. Retinal Information Network. https://web.sph.uth.edu/RetNet/ (2024).
    1. Yanik, M. et al. vivo genome editing as a potential treatment strategy for inherited retinal dystrophies. Prog. Retin. Eye Res.56, 1–18 (2017). - PubMed

LinkOut - more resources