. 2025 Apr 29;16(1):4011.
doi: 10.1038/s41467-025-58692-8.

Glycosylation of serine/threonine-rich intrinsically disordered regions of membrane-associated proteins in streptococci

Affiliations

Glycosylation of serine/threonine-rich intrinsically disordered regions of membrane-associated proteins in streptococci

Mohammad M Rahman et al. Nat Commun. .

Abstract

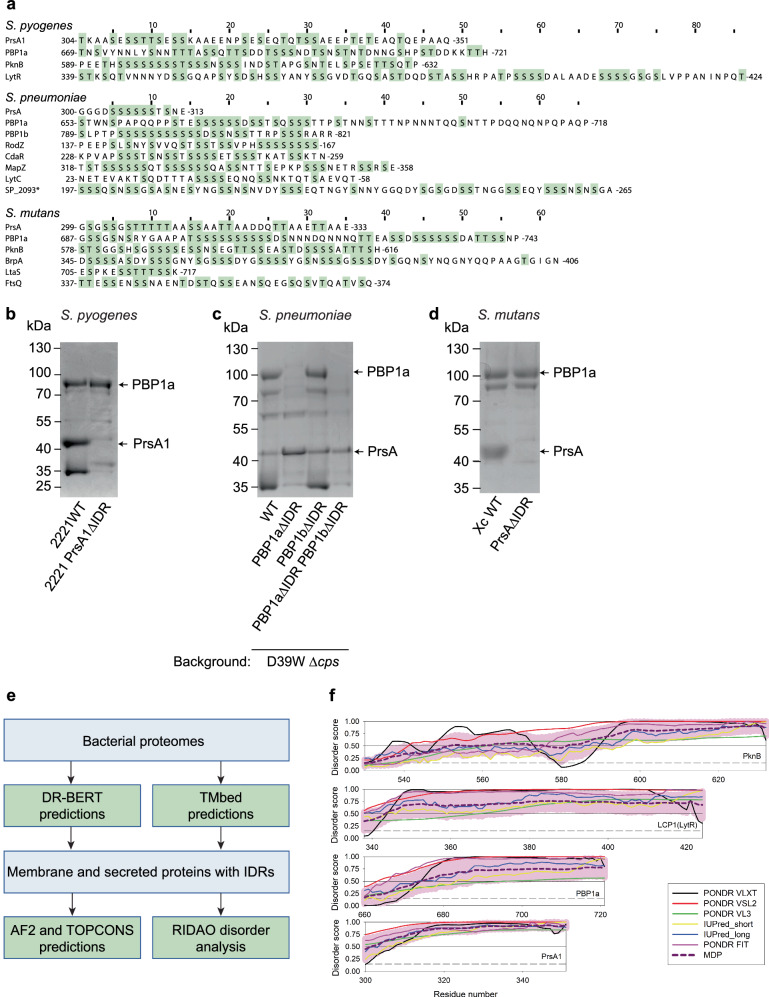
Proteins harboring intrinsically disordered regions (IDRs) lacking stable secondary or tertiary structures are abundant across the three domains of life. These regions have not been systematically studied in prokaryotes. Here, our genome-wide analysis identifies extracytoplasmic serine/threonine-rich IDRs in several biologically important membrane-associated proteins in streptococci. We demonstrate that these IDRs are glycosylated with glucose by glycosyltransferases GtrB and PgtC2 in Streptococcus pyogenes and Streptococcus pneumoniae, and with N-acetylgalactosamine by a Pgf-dependent mechanism in Streptococcus mutans. The absence of glycosylation leads to a defect in biofilm formation under ethanol-stressed conditions in S. mutans. We link this phenotype to the C-terminal IDR of the post-translocation chaperone PrsA. Our data reveal that O-linked glycosylation protects the IDR-containing proteins from proteolytic degradation and is critical for the biological function of PrsA in biofilm formation.


Conflict of interest statement

Competing interests: The authors declare no competing interests.

Figures

Fig. 1
Fig. 1. Glucosylation of S. pyogenes membrane-associated proteins.
ac Representative TLC analysis of [3H]Glc-lipids extracted from in vitro incubations of UDP-[3H]Glc with the membrane fractions isolated from S pyogenes WT (a), ΔgtrB (b), and ΔgtrB:pgtrB (c). d Coomassie-stained gel of S. pyogenes membrane proteins purified by conA affinity chromatography. Proteins in excised bands were identified by LC-MS/MS analysis as described in Methods. The major identified proteins are indicated. e, f Immunoblot analysis of PrsA1 (e) and PknB (f) in S. pyogenes WT, ΔgtrB, ΔgtrB:pgtrB, and ΔgtrB:psccN using specific antibodies. Anti-PrsA1 antibodies also recognize PrsA2. Proteins were separated on a 4-12% SurePAGE™– Bis-Tris gel (Genscript) in MES buffer in df. The experiments were performed independently three times in a, b, c, e, and f, and two times in d, yielding the same results. A representative image from one experiment is shown. g Topology of extracytoplasmic domains of S. pyogenes conA-bound proteins. * The cytoplasmic domain of PknB is omitted for clarity. Just one monomer of the dimer for PrsA1 and PknB is shown for clarity. PrsA1 is depicted as a diacylated lipoprotein because lipoproteins in streptococci are diacylated as N-acyl-glyceryl-cysteine,. Source data for af are provided as a Source Data file. Schematic in g was created in BioRender.
Fig. 2
Fig. 2. Features of Ser/Thr-rich IDRs identified in streptococcal extracytoplasmic proteins.
a IDR sequences of extracytoplasmic proteins. Ser and Thr residues are highlighted in green. Numbers correspond to amino acid residue starting and ending the IDR sequence. A * symbol denotes a TIGR4-specific protein. b A Coomassie-stained gel of S. pyogenes membrane proteins purified by ConA affinity chromatography. c A Coomassie-stained gel of S. pneumoniae D39W membrane proteins purified by ConA affinity chromatography. d A Coomassie-stained gel of S. mutans membrane proteins purified on the WFA-conjugated agarose. The proteins were eluted with 300 mM methyl α-d-mannopyranoside in b and c, and with 50 mM GalNAc in d. Proteins were separated on a 4-12% SurePAGE™ Bis-Tris gel (Genscript) in MES buffer. The experiments were performed independently two times in b and d, and three times in c. A representative image from one experiment is shown. e A flowchart outlining a genome-wide analysis of IDRs in streptococci. f Evaluation of the intrinsic disorder status of the Ser/Thr regions in S. pyogenes proteins analyzed in this study. Plots represent the per-residue disorder profiles generated for the indicated proteins by the Rapid Intrinsic Disorder Analysis Online (RIDAO) platform. RIDAO integrates six established disorder predictors, such as PONDR® VLS2, PONDR® VL3, PONDR® VLXT, PONDR® FIT, IUPred-Long, and IUPred-Short into a single, unified platform. The mean disorder profiles (MDP) for these proteins were calculated for each protein by averaging the disorder profiles of individual predictors. The light pink shade represents the calculated MDP error distribution. The thin black line at the disorder score of 0.5 is the threshold between order and disorder, where residues/regions above 0.5 are disordered, and residues/regions below 0.5 are ordered. The dashed line at the disorder score of 0.15 is the threshold between order and flexibility, where residues/regions above 0.15 are flexible, and residues/regions below 0.15 are mostly ordered. Analysis of S. pneumoniae and S. mutans proteins is shown in Supplementary Fig. 10. Source data for bd are provided as a Source Data file.
Fig. 3
Fig. 3. Glucosylation of S. pneumoniae extracytoplasmic proteins.
a Coomassie-stained gel of S. pneumoniae membrane proteins obtained from D39W Δcps and the isogenic mutants ΔgtrB and ΔpgtC2 purified by conA chromatography. Proteins in excised bands were identified by LC-MS/MS analysis. b Topology of extracytoplasmic domains of S. pneumoniae conA-bound proteins. * The cytoplasmic domains of RodZ and MapZ are omitted for clarity. T denotes TIGR4 protein. Just one monomer of the dimer for PrsA is shown for clarity. ce Immunoblot analysis of PBP1b (c), PBP1a (d), PrsA (e) in cps+ WT and the isogenic mutants. f Immunoblot analysis of MapZ in Δcps WT and the isogenic mutants. g Immunoblot analysis of the RodZ-L-FLAG variant in cps+ WT and the isogenic mutants. Samples obtained from pbp1a, pbp1b, prsA, and mapZ deletion strains (left lanes) were used to demonstrate the specificity of the antibodies in cf. The cps+ WT strain was used as a negative control in g. Proteins were separated on a 4-12% SurePAGE™ Bis-Tris gel in a, 7.5% Mini-PROTEAN® TGX™ precast protein gel in c and d, 10% precast protein gel in e, and 4–15% Mini-PROTEAN® TGX™ Precast Protein Gels in f and g. In cg, schematic representations of PBP1b, PBP1a, PrsA MapZ and RodZ are shown (top panel). Each of the single blob of PBP1b and PBP1a represents two extracellular domains. The cytoplasmic domains of RodZ and MapZ are omitted for clarity. Just one monomer of the dimer for PrsA is shown. Glc is depicted as blue circles. The experiments were performed independently two times in a and three times in cg. A representative image from one experiment is shown. Quantifications of protein loads and immunoblot band intensities of PBP1a, PBP1b, PrsA, MapZ, and RodZ are provided in Supplementary Fig. 15c, d, e, g and Supplementary Fig. 16. Source data for ag are provided as a Source Data file. Schematic in bg was created in BioRender. Korotkov, K. https://BioRender.com/y50x452.
Fig. 4
Fig. 4. The Pgf pathway glycosyltransferases transfer GalNAc on S. mutans cell surface proteins.
a Schematic representation of the pgf operon in S. mutans Xc. b Co-sedimentation of FITC-conjugated WFA with the S. mutans strains. 0 or 50 mM GalNAc was added to the binding buffer. Data were recorded as a total fluorescence vs a pellet fluorescence. Columns and error bars represent the mean and S.D., respectively (n = 3 biologically independent replicates). A two-way ANOVA with Bonferroni’s multiple comparisons test was performed to determine P values. c Fluorescence and DIC images of bacteria bond to FITC-conjugated WFA. The scale bar is 1 µm. The experiment was performed independently three times yielding the same results. A representative image from one experiment is shown. Source data for b is provided as a Source Data file.
Fig. 5
Fig. 5. The Pgf pathway glycosyltransferases glycosylate S. mutans membrane-associated proteins.
a Coomassie-stained gel of S. mutans membrane proteins purified on the WFA-conjugated agarose column. Proteins in excised bands were identified by LC-MS/MS analysis as described in Methods. The identified proteins are indicated. b Topology of extracytoplasmic domains of S. mutans WFA-bound proteins. * The cytoplasmic domains of PknB and FtsQ are omitted for clarity. Just one monomer of the dimer for PrsA and PknB is shown for clarity. PrsA is depicted as a diacylated lipoprotein. c, d Immunoblot analysis of PknB (c) and FtsQ (d) in S. mutans cell lysates using anti-PknB and anti-FtsQ antibodies. In c and d, schematic representations of PknB and FtsQ are shown (top panel). Each of the single blobs of PknB and FtsQ represents three- and two extracellular domains, respectively. * The cytoplasmic domains are not shown in the schematic. e, f Immunoblot analysis of 3 × FLAG-tagged variants of PrsA (e) and PBP1a (f) in the WT and XcΔpgfS backgrounds examined by anti-FLAG antibodies. Schematic of PrsA and PBP1a variants is shown in e and f top panels, respectively. Each of the single blobs of PBP1a represents two extracellular domains. GalNAc is depicted as yellow squares. Proteins were separated on a 15% SDS-PAGE gel in Tris-glycine buffer in a and a 4-12% SurePAGE™ Bis-Tris gel (Genscript) in MES buffer in cf. The experiments in a, c, d, e, and f were performed independently three times yielding the same results. A representative image from one experiment is shown. Quantifications of immunoblot band intensities of PrsA (e) and PBP1a (f) are provided in Supplementary Fig. 24. Schematic in bf was created in BioRender. Korotkov, K. https://BioRender.com/n69n755.
Fig. 6
Fig. 6. PrsA IDR is necessary for S. mutans protein-based biofilm under ethanol stress.
a Biofilm formation of S. mutans WT, XcΔpgfS, and XcΔpgfS:ppgfS. b Biofilm formation of S. mutans strains expressing the IDR-less variants of PrsA, PknB, BrpA, and PBP1a (prsAΔIDR, pknBΔIDR, brpAΔIDR, and pbp1aΔIDR) or deficient in four cell wall-associated adhesins WapA, Cnm, CnaA, and CnaB (ΔCBA). The pbp1aΔIDR mutant is the pbp1aΔIDR-3 × FLAG strain. c Biofilm formation of S. mutans WT, XcΔprsA, and XcΔprsA:pprsA. d Terminal positions of the truncated variants of S. mutans PrsA, prsAΔIDR_8, and prsAΔIDR_23 are indicated by arrows. e Biofilm phenotype of S. mutans strains expressing PrsA with truncations in the C-terminal IDR. f, g Biofilm formation of S. mutans strains expressing PrsA variants with the chimeric IDRs. In e, f, and g, schematic representations of PrsA variants are shown (top panel). GalNAc is depicted as yellow squares. In a, b, c, e, f, and g, bacterial strains were grown in the UFTYE-glucose medium supplied with 3.5% ethanol for 24 h. Representative biofilms stained with crystal violet are shown in the top panels. Quantifications of biofilm formation are shown in the bottom panels. Columns and error bars represent the mean and S.D., respectively (n = 3 in a, b, c, and g; n = 4 in f and n = 5 in e biologically independent replicates). P values were calculated by one-way ANOVA with Tukey’s (a, c, e, f, and g) and Dunnett’s (b) multiple comparisons test. Source data for a, b, c, e, f, and g are provided as a Source Data file. Schematic in e, f, and g was created in BioRender. Korotkov, K. https://BioRender.com/k83i679.
Fig. 7
Fig. 7. O-glycosylation protects the PrsA IDR from proteolysis in S. mutans.
a Immunoblot analysis of PrsA in WT, XcΔpgfS, and XcΔpgfS:ppgfS grown in normal or ethanol-stressed conditions. PrsA is probed with anti-PrsA antibodies. b, c Immunoblot analysis of 3 × FLAG-tagged variant of PrsA in the WT and XcΔpgfS backgrounds grown in normal or ethanol-stressed conditions. PrsA is probed with anti-FLAG antibodies in (b) and anti-PrsA antibodies in (c). d, e Immunoblot analysis of PrsA variants harboring the chimeric IDRs in the WT and XcΔpgfS backgrounds grown in normal conditions. PrsA is probed with anti-PrsA antibodies. Proteins were separated on a 4−12% SurePAGE™ Bis-Tris gel (Genscript) in MES buffer in ae. Schematic of PrsA variants is shown in a, b, c, d, and e top panels. GalNAc is depicted as yellow squares. In ac and e, the red arrow indicates a non-glycosylated form of PrsA and the black circle denotes the proteolytic products of PrsA. The experiments were performed independently three times in a, b, d, e, and two times in c, and they yielded the same results. A representative image from one experiment is shown. Source data for ae are provided as a Source Data file. Schematic in ad, and e was created in BioRender. Korotkov, K. https://BioRender.com/b86a392.
Fig. 8
Fig. 8. Function of O-glycosylation in the PrsA proteolytic stability and biofilm development in S. mutans.
a Immunoblot analysis of PrsA variants carrying the truncated IDRs in the WT and XcΔpgfS backgrounds grown in normal conditions. PrsA is assessed by anti-PrsA antibodies. The red arrow and the black circle denote a non-glycosylated form- and the proteolytic products of PrsA, respectively. The experiments were performed independently three times and they yielded the same results. A representative image from one experiment is shown. b Relative band intensities of S. mutans PrsA variants with the truncated IDRs. The representative immunoblot is shown in a. Total band intensities from each blot lane were calculated using ImageJ, and the data were normalized. Columns and error bars represent the mean and S.D., respectively (n = 3 biologically independent replicates). P values were determined by one-way ANOVA with Dunnett’s multiple comparisons test. In a and b, schematic of PrsA variants is shown in top panel. GalNAc is depicted as yellow squares. c The PrsA C-terminal IDR plays a functional role in S. mutans biofilm formation in ethanol-stressed cells. The Pgf-dependent protein O-glycosylation machinery covalently attaches GalNAc moieties to the C-terminal IDR of the post-translocation secretion chaperone PrsA. This functional form of PrsA prevents misfolding of protein clients in ethanol-stressed conditions supporting the development of a protein-based biofilm. Loss of O-glycosylation exposes the IDR to proteolytic attack, resulting in a non-functional PrsA, which does not aid in biofilm formation. Source data for a and b are provided as a Source Data file. Schematic in ac was created in BioRender. Korotkov, K. https://BioRender.com/j83x367.

Update of

References

    1. Bondos, S. E., Dunker, A. K. & Uversky, V. N. Intrinsically disordered proteins play diverse roles in cell signaling. Cell Commun. Signal20, 20 (2022). - PMC - PubMed
    1. Peng, Z. et al. Exceptionally abundant exceptions: comprehensive characterization of intrinsic disorder in all domains of life. Cell Mol. Life Sci.72, 137–151 (2015). - PMC - PubMed
    1. Uversky, V. N. Functional unfoldomics: Roles of intrinsic disorder in protein (multi)functionality. Adv. Protein Chem. Struct. Biol.138, 179–210 (2024). - PubMed
    1. Ward, J. J., Sodhi, J. S., McGuffin, L. J., Buxton, B. F. & Jones, D. T. Prediction and functional analysis of native disorder in proteins from the three kingdoms of life. J. Mol. Biol.337, 635–645 (2004). - PubMed
    1. Uversky, V. N. Paradoxes and wonders of intrinsic disorder: Prevalence of exceptionality. Intrinsically Disord. Proteins3, e1065029 (2015). - PMC - PubMed

MeSH terms

LinkOut - more resources