. 2025 Apr 30;16(1):4041.
doi: 10.1038/s41467-025-59207-1.

PDGFRα signaling regulates cartilage and fibrous tissue differentiation during synovial joint development

Affiliations

PDGFRα signaling regulates cartilage and fibrous tissue differentiation during synovial joint development

John P Woods et al. Nat Commun. .

Abstract

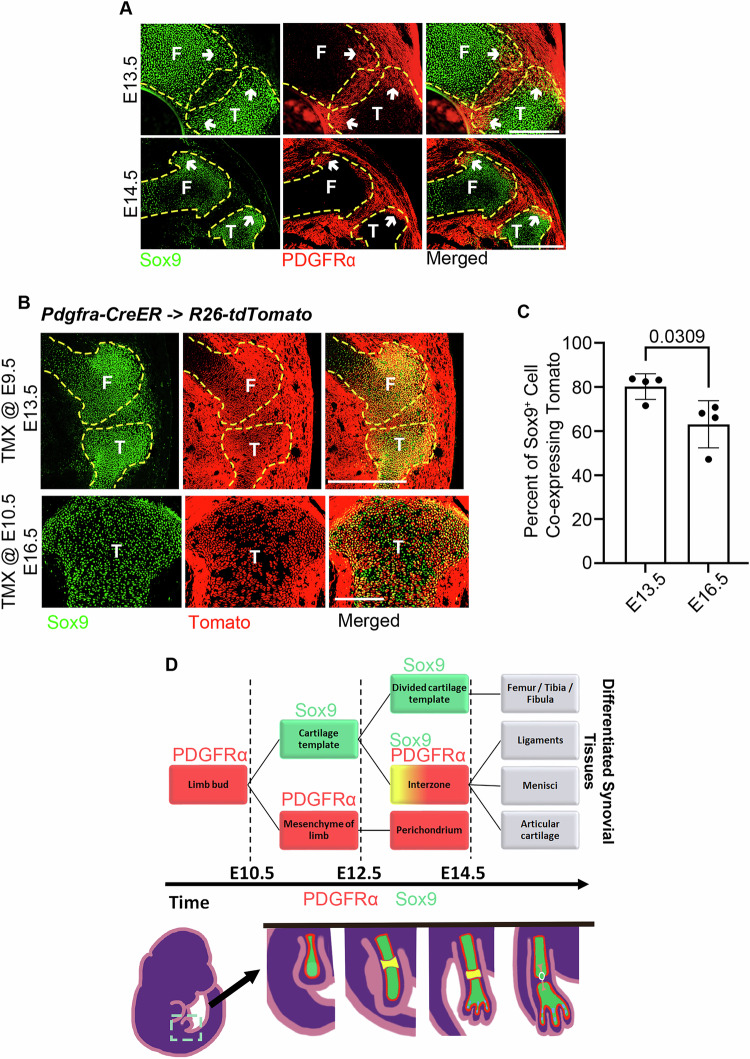
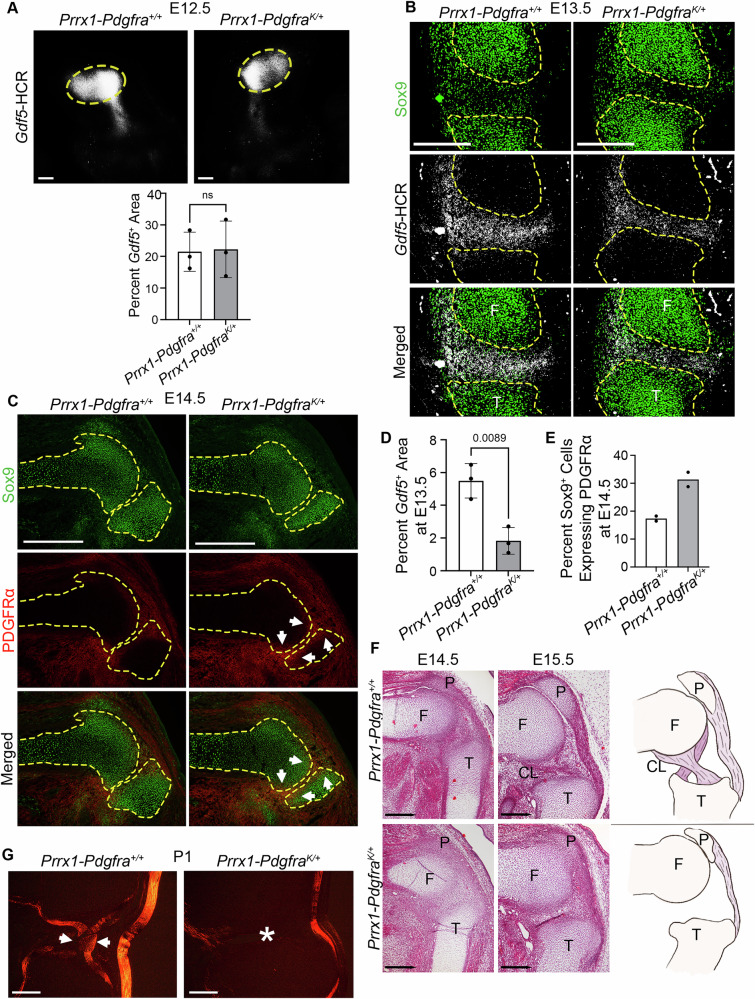
Synovial joints develop from mesenchymal structures called interzones, with progenitor cells differentiating into specialized cartilaginous and fibrous tissues of the joint. Platelet-derived growth factor receptor-α (PDGFRα) is a tyrosine kinase expressed by cells of the limb bud, but its role in limb development is unknown. To investigate PDGFRα function, we generated mice expressing mutant PDGFRα with a point mutation (D842V) that increases receptor signaling. Mutant hindlimbs are immobile with knee joints fused by cartilage and lacking ligaments and menisci. The interzone marker Gdf5 is initially expressed at E12.5 but is downregulated thereafter, suggesting a defect in interzone maintenance. Omics analysis of the joint tissues identifies ectopic cartilage matrix expressing genes for cartilage and fibrotic tissue. Thus, elevated PDGFRα signaling corrupts joint development by downregulating Gdf5 and redirecting interzone progenitors into a fibrocartilage fate. This suggests that tight regulation of tyrosine kinase activity is necessary for the development of the mouse knee joint.


Conflict of interest statement

Competing interests: The authors declare no competing interests.

Figures

Fig. 1
Fig. 1. Dynamic spatial expression of PDGFRα and Sox9 in limb and joint development.
Dotted lines indicate Sox9+ cartilage template. A Fluorescent microscope images for Sox9 and PDGFRα in sagittal knee sections at E13.5 and E14.5. White arrows indicate areas of PDGFRα and Sox9 co-expression (n = 4 for both E13.5 and E14.5). E13.5 scale bar = 200 μm, E14.5 scale bar = 400 μm. B Confocal images of PDGFRα lineage tracing using PDGFRα-CreER × R26-LSL-tdTomato, co-stained with Sox9 antibody (n = 4 for both E13.5 and E14.5). Tamoxifen was administered (50 mg/kg) at E9.5 or E10.5, and hindlimbs were harvested at E13.5 or E16.5, respectively. E13.5 scale bar = 500 μm and E16.5 scale bar = 200 μm. C Quantification of the percentage of Sox9+ cells that co-express Tomato (n = 4 embryos per time point). Data plotted as mean ± SD, Two-tailed, unpaired t-test. D Schematic depicting the expression of PDGFRα and Sox9 in the limb bud and knee interzone during hindlimb development, and cartoon depicting stages of limb/joint development. F femur, T tibia. Source data are provided as a Source Data file.
Fig. 2
Fig. 2. PDGFRα gain-of-function causes joint fusion at birth.
A Schematic of Prrx1-Cre and PdgfraK constructs. B Table showing observed and expected inheritance patterns. C P0 pups showing extended position of mutant hindlimbs. D Alizarin red and alcian blue whole mount skeletal preparations of P0 knee. Black arrows indicate cavitated joints and dotted circles indicate joints with incomplete cavitation. E Masson’s trichrome stain of sagittal sectioned knees at P1 (n = 3). E1 Zoom-in on the cavitated joint space showing the cruciate ligament in the control, which is absent in the mutant. E2 Zoom-in on the patella tendon enthesis (dotted ellipse), which is enlarged and misshapen in the mutant. F Safranin O stain of sagittal sectioned knees at P1 (n = 3). F1 Zoom-in on the femoral enthesis. Black arrows indicate ectopic cartilage matrix in the mutant perichondrium near the femoral enthesis (dotted ellipse). F2 Zoom-in on the femur articular cartilage. White arrows indicate intact perichondral border in the control. Black arrows indicate ectopic cartilage matrix in the mutant perichondrium. F3 Zoom-in on the patellar tendon enthesis (dotted ellipse) which is enlarged and misshapen in the mutant. Zoom-out scale bar = 500 μm, zoom-in = 200 μm. F femur, T tibia, P patella, CL cruciate ligaments, PT patellar tendon, E enthesis, R Ranvier’s Groove, Fi fibula, M meniscus.
Fig. 3
Fig. 3. Prrx1-PdgfraK/+ mutants fail to maintain the interzone.
A Whole mount hindlimb at E12.5, showing in situ hybridization of Gdf5. Dotted circle indicates interzone. Quantification depicts the percentage of the limb that is Gdf5 positive (n = 3 embryos). Scale bars = 100 μm. B Sagittal hindlimb sections at E13.5, showing in situ hybridization of Gdf5 co-stained with Sox9 antibody (n = 3 embryos per genotype). Scale bar = 200 μm. C Sagittal hindlimb sections at E14.5, showing PDGFRα and Sox9 antibody staining. White arrows indicate expanded PDGFRα+ area into Sox9+ cartilage borders. Scale bar = 400 μm. For (B, C), dotted yellow lines outline the cartilage of the developing femur and tibia. D Quantification of (B) depicting the percentage of the tissue section that is Gdf5+ (n = 3 embryos per genotype). E Quantification of (C) depicting the percentage of Sox9 positive cells that co-express PDGFRα (n = 2 embryos per genotype). F Masson’s trichrome stain of sagittal sectioned knees at E14.5 and E15.5, and cartoon depiction of embryonic knee at E15.5 with absent cruciate ligaments and reduced patellar tendon (n = 4 for both E14.5 and E15.5). Scale bar = 500 μm. G Picrosirius red stain of Sagittal sectioned knees at P1 (n = 2). White arrows point to the cruciate ligaments in the control. The white star indicates the lack of ligaments in the mutant joint space. Scale bar = 200 μm. F femur, T tibia, P patella, CL cruciate ligament. A, D Data are plotted as mean ± SD, Two-tailed, unpaired t-test. Source data are provided as a Source Data file.
Fig. 4
Fig. 4. Gdf5-PdgfraK/+ and Sox9-PdgfraK/+ mice have normal knee joint development.
A Masson’s trichrome of E16.5 sagittal knee sections, showing normal morphology in Gdf5-PdgfraK/+ mutants (n = 3). Scale bar = 500 μm. B Diagram of how intersectional lineage tracing works: Cre acting on the PdgfraK allele induces expression of PDGFRαK and Flp controlled by the Pdgfra promoter, and Flp activity induces tdTomato expression. Thus, tdTomato labels cells where Cre and Flp were sequentially expressed. C Sagittal knee section from a Gdf5-PdgfraK/+ mouse at postnatal day 16 showing intersectional reporter activity in all joint structures (n = 3). Scale bar = 500 μm. D Lineage tracing in coronal sections of E16.5 knee using Sox9-CreER × R26-LSL-tdTomato with TMX given at E9.5, E10.5, and E11.5 (n = 4). Scale bar = 200 μm. E Sox9-CreER lineage tracing in the whole embryo at E16.5, showing Tomato-labeling of the elbow and knee joints (arrows). F Immunofluorescence and intersectional lineage tracing of Sox9-Pdgfra+/+ and Sox9-PdgfraK/+ coronal knee sections at E16.5 showing normal joint morphology and expression of Sox9 and Tomato (n = 4). Scale bar = 200 μm. G Sox9-PdgfraK/+ intersectional lineage tracing in the whole embryo at E16.5, showing Tomato-labeling of joints (arrows). F femur, T tibia, P patella, PT patellar tendon, FP fat pad, CL cruciate ligament.
Fig. 5
Fig. 5. Disrupted interzone progenitor populations in Prrx1-PdgfraK/+ mutant joints.
A UMAP showing skeleton and joint-related clusters C0–C7. Chondroprogenitor and interzone clusters are sub-clustered in (DH). B Dot plot showing genes used to assign cell types. C Violin plots of gene expression levels in interzone progenitors (C1). D Scatter plot showing Col1a1 and Col2a1 expression levels of individual cells from the interzone progenitor cluster (C1) at E15.5. E UMAP showing sub-clustering of the interzone progenitor and chondroprogenitor clusters as SC0–SC7. F Dot plot showing genes of interest for determining sub-cluster IDs. G RNA velocity of chondroprogenitor and interzone progenitor subclusters separated by genotype and time point. Red dotted circle and yellow arrows indicate trajectories of interest. H Feature plots showing upregulation of Col2a1 expression in perichondral progenitors-2 (SC4) (indicated by dotted black circle) at E15.5.
Fig. 6
Fig. 6. Prrx1-PdgfraK/+ knee joints develop ectopic fibrocartilage.
A Tissue sections with staining for CYTO13 (nuclei) and Sox9 with schematic depiction of ROI selection used for NanoString GeoMx (E14.5 knee sections of 2 control and 2 mutant littermate). The number ROIs selected for each of five tissue types and each genotype are shown in the table. B Principal component analysis of ROIs by genotype (indicated by dotted lines). C tdTomato expression level of ROIs. D Principal component analysis of ROIs by tissue type with dotted lines indicating genotype distinctions. E Pdgfra, Sox9, Gdf5, Sfrp2, Col1a1, and Col2a1 expression in each ROI. F Violin plots of Pdgfra, Sox9, Gdf5, Sfrp2, Col1a1, and Col2a1 expression by genotype and tissue type. Heatmap of upregulated (G) and downregulated DEGs (H) in the comparison of mutant interzone ROIs (Sox9-low interzone and Sox9-high interzone) and control interzone ROIs (Sox9-low interzone). Upregulated genes are related to ribosome, PTPR, and skeletal differentiation. Downregulated genes are related to BMP/TGFβ, WNT, caherin/gap junction, and cytoskeleton/ECM. I Volcano plot of DEGs between mutant Sox9-high interzone and mutant Sox-low interzone. Cartilage genes (Col2a1, Col9a2, Col9a3) are enriched in Sox9-high interzone. J Volcano plot showing DEGs between mutant Sox9-high interzone and mutant femur/tibia cartilage. Fibrogenic genes (Postn and Col1a1) are enriched in Sox9-high interzone. GJ DEGs were defined as p-value ≤ 0.05 and | Log2FC | fold change ≥ 0.25. Source data are provided as a Source Data file.
Fig. 7
Fig. 7. Spatiotemporally impaired interzone-resident cells and signaling in Prrx1-PdgfraK/+ mutant joints.
A Heat maps for each genotype showing which scRNA-seq clusters (y-axis) are found in each ROI (x-axis). Plotted values are scaled for the abundance of each cluster type within an ROI, and ROI colors are the same as Fig. 6A. B Bar graph of the same data as the heat maps shown in (A), showing the proportion of each cluster in each tissue after combining all ROIs of a given tissue. Cluster C0 through C7 colors are the same as Fig. 5A. C Comparison of information flow (cell-to-cell signaling) from mesenchyme-2 (C6) to interzone progenitors (C1), and from interzone progenitors (C1) to mesenchyme-2 (C6) at E13.5. D Comparison of GAP, MK, LAMININ, NOTCH, and noncanonical WNT signaling at E13.5.

References

    1. Fallon, E. A. et al. Prevalence of diagnosed arthritis—United States, 2019-2021. MMWR Morb. Mortal. Wkly. Rep.72, 1101–1107 (2023). - PMC - PubMed
    1. Loeser, R. F., Goldring, S. R., Scanzello, C. R. & Goldring, M. B. Osteoarthritis: a disease of the joint as an organ. Arthritis Rheum.64, 1697–1707 (2012). - PMC - PubMed
    1. Fox, A. J., Wanivenhaus, F., Burge, A. J., Warren, R. F. & Rodeo, S. A. The human meniscus: a review of anatomy, function, injury, and advances in treatment. Clin. Anat.28, 269–287 (2015). - PubMed
    1. Goldring, S. R. Pathogenesis of bone and cartilage destruction in rheumatoid arthritis. Rheumatology42, 11–16 (2003). - PubMed
    1. Lefebvre, V. & de Crombrugghe, B. Toward understanding SOX9 function in chondrocyte differentiation. Matrix Biol.16, 529–540 (1998). - PubMed

MeSH terms

Substances

LinkOut - more resources