. 2025 Apr 29;16(1):4038.
doi: 10.1038/s41467-025-59345-6.

Substantial spillover burden of rat hepatitis E virus in humans

Affiliations

Substantial spillover burden of rat hepatitis E virus in humans

Zihao Chen et al. Nat Commun. .

Abstract

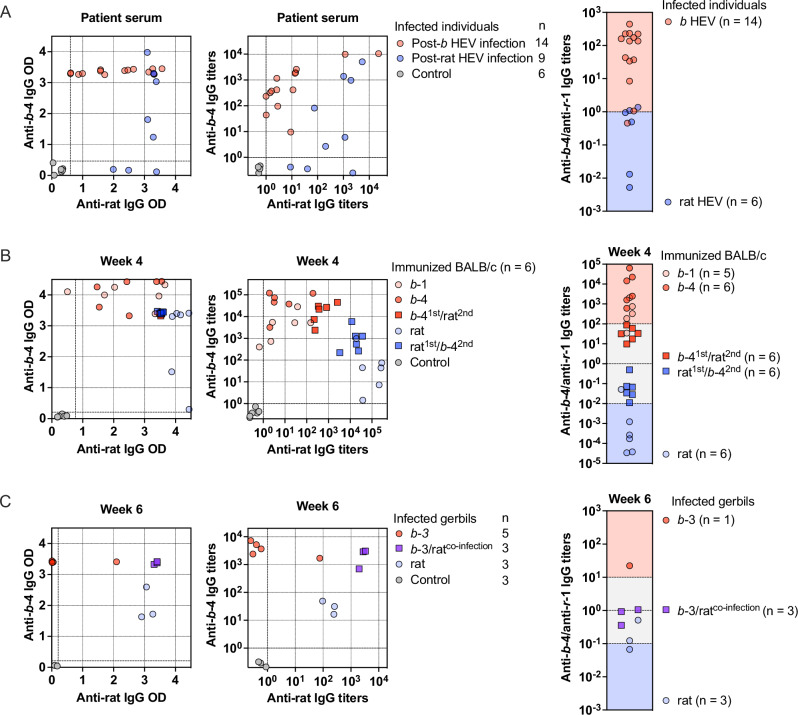
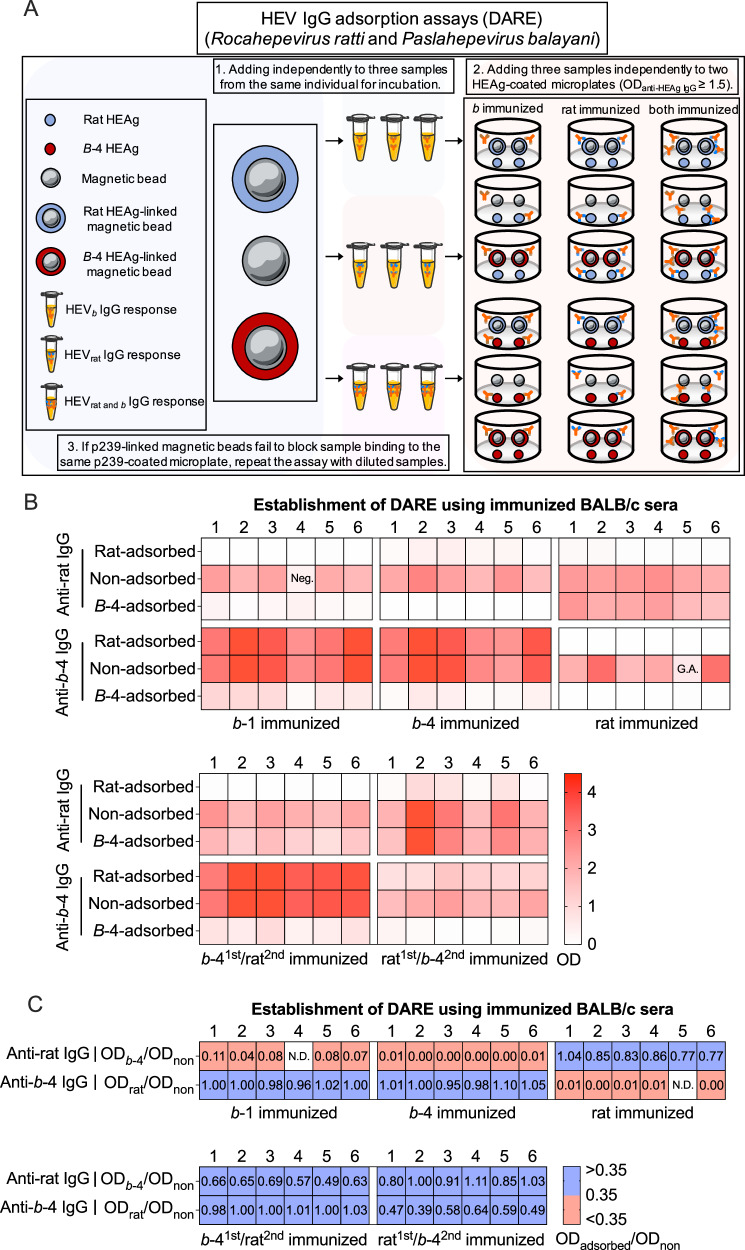
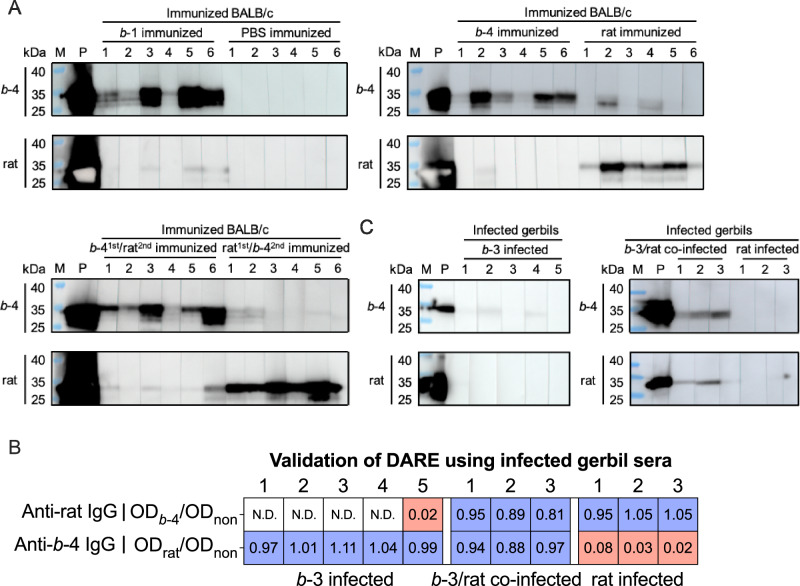
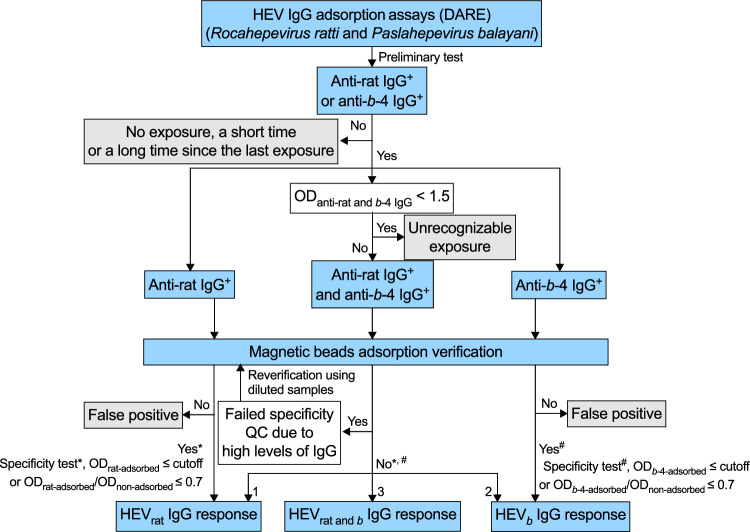
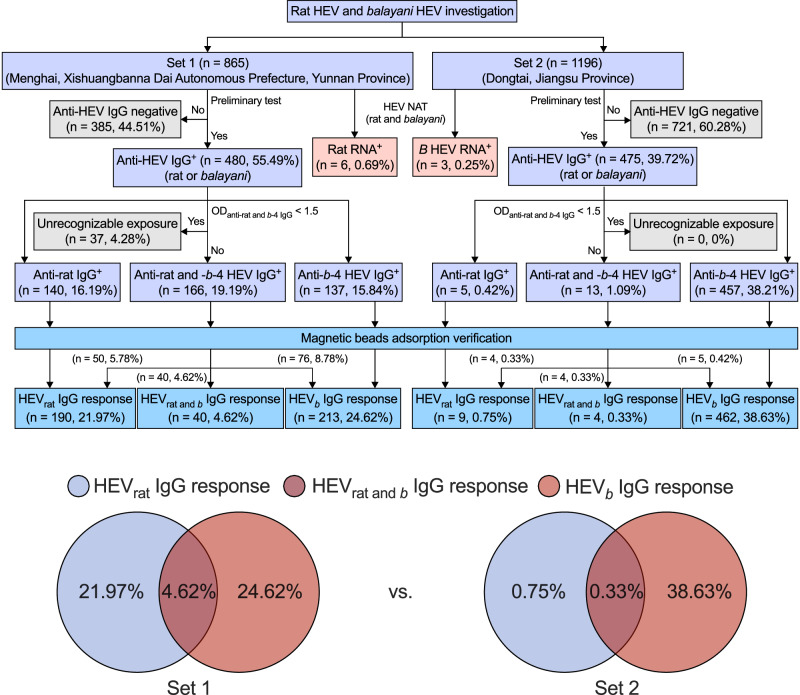
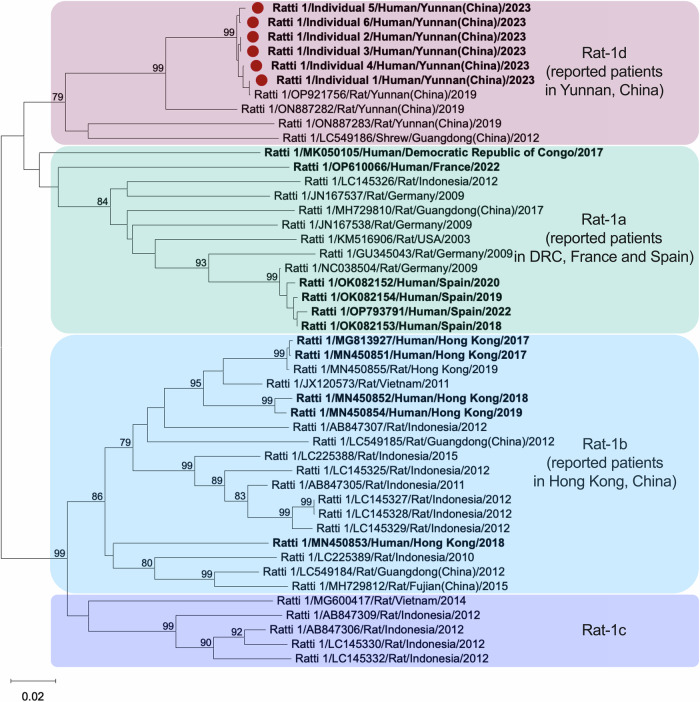
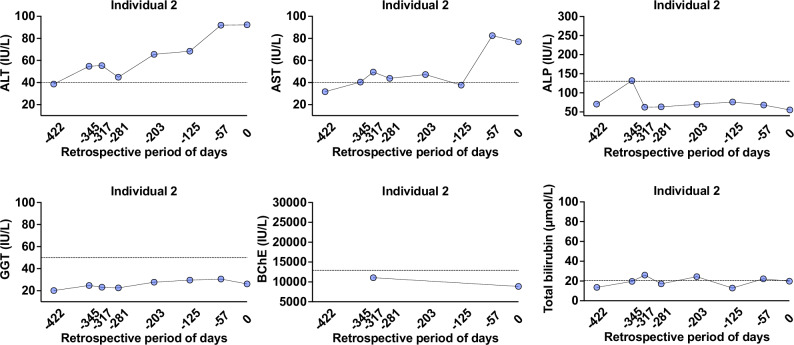
The emergence of Rocahepevirus ratti genotype 1 (rat hepatitis E virus; rat HEV) in humans presents an unprecedented threat; however, the risk of rat HEV transmission to humans is not well understood. Here, we report the "Distinguishing Antibody Response Elicitation (DARE)" method, which distinguishes exposure to rat HEV. We use four study sets from China for large-scale population analysis: set 1 (hospital visit) and set 3 (ALT abnormality) from Yunnan province, a biodiversity hotspot, and set 2 (received physical examination) and set 4 (ALT abnormality) from Jiangsu province, a non-hotspot control region. rat HEV exposure risk is significantly higher in Yunnan, with 21.97% (190 of 865) in set 1 and 13.97% (70 of 501) in set 3, compared to 0.75% (9 of 1196) in Jiangsu's set 2. Six spillover infections for rat HEV are identified in set 1, with one case of abnormal ALT. The rat-1d strains carried by rats are closely related to those human infections. Our study reveals the substantial spillover burden posed by rat HEV in biodiversity hotspots and highlights the utility of DARE method for proactive surveillance of public health emergencies.


Conflict of interest statement

Competing interests: The authors declare no competing interests.

Figures

Fig. 1
Fig. 1. Antibody response analysis.
Two-dimensional scatter plot of HEV IgG levels in HEV RNA-positive samples (A), immunized BALB/c samples at week 4 (B), and infected gerbil samples at week 6 (C). HEV IgG levels were evaluated using serial dilutions of serum samples. Samples were simultaneously tested with rat p239 (blue dots) and b−4 p239 (red dots). The X-axis represents anti-rat HEV IgG titer levels; the Y-axis represents anti-b−4 HEV IgG titer levels. Healthy controls were individuals unexposed to either HEV. Each serum sample was tested in duplicate. The dashed line indicates the HEV IgG assay cutoff, defined as 2.5 times the mean reading of healthy control samples. Binding trends for anti-rat and anti-b−4 HEV IgG were evaluated in HEV RNA-positive samples (A), immunized BALB/c samples at week 4 (B), and infected gerbil samples at week 6 (C). The ratio values of anti-rat HEV IgG titer levels divided by anti-b−4 HEV IgG titer levels were calculated to assess HEV exposure characteristics in various situations. Initial exposure to b HEV (red) or rat HEV (blue) immunogens for BALB/c samples and gerbil samples are shown, with a single and dual exposures designated as circles and squares, respectively. Source data are provided as a Source Data file. b HEV species HEV balayani, b-1 species HEV balayani-1, b-3 species HEV balayani-3, b−4 species HEV balayani−4, HEV hepatitis E virus, rat HEV species HEV ratti-1.
Fig. 2
Fig. 2. Establishment of the DARE method for identifying HEV antibody response.
A Establishment of the DARE method. The overall scheme is shown. Before detecting anti-rat and anti-b−4 HEV IgG simultaneously, three samples from the same individual were separately incubated with two p239-linked magnetic beads and unlinked magnetic beads. After the adsorption process, the three samples from the same individual were independently added to two p239-coated microplates. B Adsorption of serum samples from immunized BALB/c at week 4. Samples were separately incubated with rat p239- and b−4 p239-linked magnetic beads, then simultaneously tested in rat p239 and b-4 p239. Samples adsorbed to unlinked magnetic beads served as controls. C Algorithm setup. The ODadsorbed/ODnon ratio values, representing the OD values after adsorption with two p239-linked magnetic beads (ODadsorbed) divided by the OD values after adsorption with one unlinked magnetic beads (ODnon), were calculated to analyze the exposure situation. An ODadsorbed/ODnon ratio value of 0.35 was used to identify the IgG response, effectively distinguishing between single and dual immunogen/HEV recent exposures. Blue boxes represent samples incubated with p239-linked magnetic beads, where an ODadsorbed/ODnon ratio value is greater than 0.35 (insufficient adsorption). Red boxes represent samples incubated with p239-linked magnetic beads, where an ODadsorbed/ODnon ratio value is less than or equal to 0.35 (sufficient adsorption). Source data are provided as a Source Data file. b HEV species HEV balayani, b−1 species HEV balayani-1, b−4 species HEV balayani−4, DARE distinguishing antibody response elicitation, GA gray area, HEAg hepatitis E virus antigen, HEV hepatitis E virus, Neg. negative, rat HEV species HEV ratti-1.
Fig. 3
Fig. 3. Validation of the DARE method for identifying HEV antibody response.
A Immunoblot using immunized BALB/c samples at week 4. Immunoblot was used to validate the accuracy of the DARE method established with immunized BALB/c samlpes at week 4. Parallel b−4 p239 and rat p239 immunoblots were conducted using immunized BALB/c samples at week 4 to identify HEV antibody response. M represents the lane labeled with the marker. P indicates the positive control, representing the lane labeled with an antibody that cross-reacts with both b HEV and rat HEV. Two times each experiment was repeated independently with similar results. B Algorithm validation using infected gerbil samples at week 6. An ODadsorbed/ODnon ratio value of 0.35 was used in the algorithm setup to identify the IgG response, effectively distinguishing immunized BALB/c samples at week 4 between single and dual immunogen/HEV recent exposures. Infected gerbil samples at week 6 were used to validate the algorithm setup with an ODadsorbed/ODnon ratio value of 0.35. Blue boxes represent samples incubated with p239-linked magnetic beads, where an ODadsorbed/ODnon ratio value is greater than 0.35 (insufficient adsorption). Red boxes represent samples incubated with p239-linked magnetic beads, where an ODadsorbed/ODnon ratio value is less than or equal to 0.35 (sufficient adsorption). C Immunoblot using infected gerbil samples at week 6. An immunoblot was used to validate the accuracy of the DARE method established with immunized BALB/c at week 4. Parallel b−4 p239 and rat p239 immunoblots were conducted using infected gerbil samples at week 6 to identify HEV antibody response. M represents the lane labeled with the marker. P indicates the positive control, representing the lane labeled with an antibody that cross-reacts with both b HEV and rat HEV. Two times each experiment was repeated independently with similar results. Source data are provided as a Source Data file. b HEV species HEV balayani, b-1 species HEV balayani-1; b-3 species HEV balayani-3, b−4 species HEV balayani−4, DARE distinguishing antibody response elicitation, HEV hepatitis E virus, rat HEV species HEV ratti-1.
Fig. 4
Fig. 4. Workflows and algorithm for the DARE method.
The algorithm was based on rigorous experimental data. To further facilitate the reliability and the convenience of the DARE method in large populations, an optimized workflow and algorithm are proposed. In the figure, the labels 1, 2, and 3 indicate the algorithms applied when ODanti-rat and b−4 IgG ≥ 1.5. Label 1 corresponds to the condition where ODb-4-adsrobed/ODnon-adsorbed > 0.35 (anti-rat IgG) and ODrat-adsrobed/ODnon-adsorbed ≤ 0.35 (anti-b-4 IgG), which is designated as HEVrat IgG response. Label 2 corresponds to the condition where ODb-4-adsrobed/ODnon-adsorbed ≤ 0.35 (anti-rat IgG) and ODrat-adsrobed/ODnon-adsorbed > 0.35 (anti-b-4 IgG), which is designated as HEVb IgG response. Label 3 represents all cases except those of labels 1 and 2, which is designated as HEVrat and b IgG response. For the cases where ODanti-rat IgG ≥ 1.5 and ODanti-b-4 IgG < 1.5, different algorithms are applied. Label 1 corresponds to the condition where ODb-4-adsrobed/ODnon-adsorbed > 0.35 (anti-rat IgG) or anti-rat/anti-b-4 IgG titers > 102, which is designated as HEVrat IgG response. All other conditions are designated as unrecognizable exposure. For the cases where ODanti-rat IgG < 1.5 and ODanti-b-4 IgG ≥ 1.5, different algorithms are applied. Label 1 corresponds to the condition where ODrat-adsrobed/ODnon-adsorbed > 0.35 (anti-b-4 IgG) or anti-b-4/anti-rat IgG titers >102, which is designated as HEVb IgG response. All other conditions are designated as unrecognizable exposure. b HEV species HEV balayani, b-4 species HEV balayani-4, DARE distinguishing antibody response elicitation, HEV hepatitis E virus, OD optical density, QC quality control, rat HEV species HEV ratti−1.
Fig. 5
Fig. 5. Spillover burden of rat HEV in set 1 and set 2.
The summary of HEV spillover risk and infection in the two sets is displayed on the left and right, respectively. Purple boxes represent the results of a preliminary test using anti-HEV IgG assays. Gray boxes represent identification of anti-HEV IgG negative individuals and unrecognizable exposure. Blue boxes represent identification of HEVrat, HEVrat and b, and HEVb IgG responses using the DARE method. Additionally, red boxes represent results of HEV nucleic acid testing. Source data are provided as a Source Data file. b HEV species HEV balayani, b−4 species HEV balayani−4, HEV hepatitis E virus, NAT nucleic acid testing, rat HEV species HEV ratti−1.
Fig. 6
Fig. 6. Phylogenetic tree of partial rat HEV ORF1 genome.
Phylogenetic tree was reconstructed by the neighbor-joining method based on a partial RdRp gene of the rat HEV ORF1. Viral species and genotype, GenBank accession number, virus host, country (province or state) of origin, and year of collection are indicated. Sequences obtained in rat HEV-infected individuals from set 1 are highlighted with a red circle (GenBank nos. PQ001569-PQ001574). HEV strains derived from human-infected are marked in bold. Bootstrap values >70 are shown. Source data are provided as a Source Data file. HEV hepatitis E virus, ORF1 the open reading frame 1, rat HEV species HEV ratti−1, RdRp RNA-dependent RNA polymerase.
Fig. 7
Fig. 7. Retrospective analysis of liver markers in individual 2 with rat HEV spillover infection.
Liver markers in individual 2 with positive rat HEV RNA were traced. Liver markers include ALT, AST, ALP, GGT, BChE, and total bilirubin. Data points are marked as blue circles. Source data are provided as a Source Data file. ALP alkaline phosphatase, ALT alanine aminotransferase, AST aspartate aminotransferase, BChE butyrylcholinesterase, GGT gamma-glutamyl transferase, rat HEV species HEV ratti−1.

Similar articles

Cited by

References

    1. Armien, B. et al. High seroprevalence of hantavirus infection on the Azuero peninsula of Panama. Am. J. Trop. Med. Hyg.70, 682–687 (2004). - PubMed
    1. Brisse, M. E. & Ly, H. Hemorrhagic fever-causing arenaviruses: lethal pathogens and potent immune suppressors. Front. Immunol.10, 372 (2019). - PMC - PubMed
    1. Demeure, C. et al. Yersinia pestis and plague: an updated view on evolution, virulence determinants, immune subversion, vaccination and diagnostics. Microbes Infect.21, 202–212 (2019). - PubMed
    1. Wu, Z. et al. Comparative analysis of rodent and small mammal viromes to better understand the wildlife origin of emerging infectious diseases. Microbiome6, 178 (2018). - PMC - PubMed
    1. Wu, Z. et al. Decoding the RNA viromes in rodent lungs provides new insight into the origin and evolutionary patterns of rodent-borne pathogens in Mainland Southeast Asia. Microbiome9, 18 (2021). - PMC - PubMed

MeSH terms

LinkOut - more resources