. 2025 Apr 29;16(1):3995.
doi: 10.1038/s41467-025-59354-5.

Enrichment of human IgA-coated bacterial vesicles in ulcerative colitis as a driver of inflammation

Affiliations

Enrichment of human IgA-coated bacterial vesicles in ulcerative colitis as a driver of inflammation

Himadri B Thapa et al. Nat Commun. .

Abstract

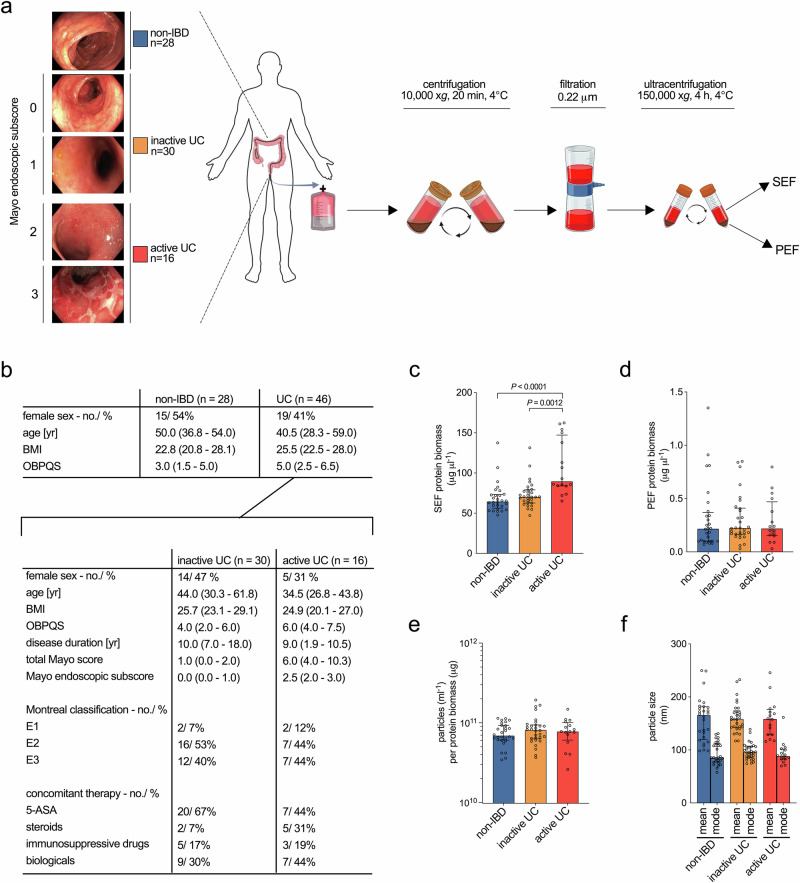
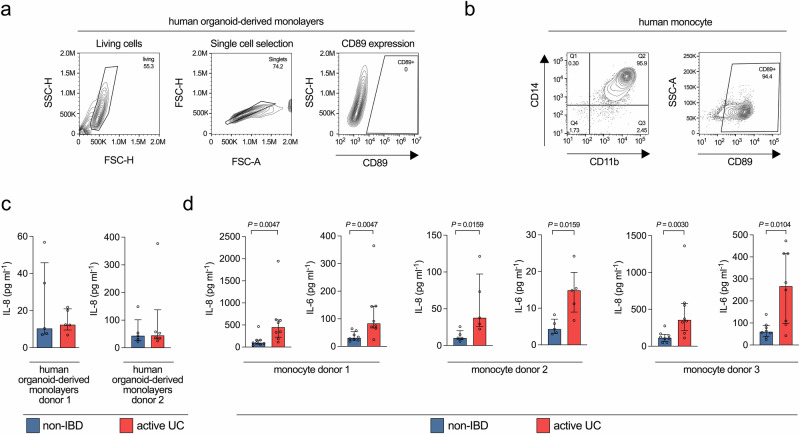
The gut microbiome contributes to chronic inflammatory responses in ulcerative colitis (UC), but molecular mechanisms and disease-relevant effectors remain unclear. Here we analyze the pro-inflammatory properties of colonic fluid obtained during colonoscopy from UC and control patients. In patients with UC, we find that the pelletable effector fraction is composed mostly of bacterial extracellular vesicles (BEVs) that exhibit high IgA-levels and incite strong pro-inflammatory responses in IgA receptor-positive (CD89+) immune cells. Biopsy analyses reveal higher infiltration of CD89+ immune cells in the colonic mucosa from patients with UC than control individuals. Further studies show that IgA-coated BEVs, but not host-derived vesicles nor soluble IgA, are potent activators of pro-inflammatory responses in CD89+ cells. IgA-coated BEVs also exacerbate intestinal inflammation in a dextran sodium sulfate colitis model using transgenic mice expressing human CD89. Our data thus implicate a link between IgA-coated BEVs and intestinal inflammation via CD89+ immune cells, and also hint a potential new therapeutic target for UC.


Conflict of interest statement

Competing interests: The authors declare no competing interests.

Figures

Fig. 1
Fig. 1. Summary of human group assessment, colonic luminal sample processing and characterization of effector fractions.
a Classification of the enrolled patients (n = 74) in the study groups: non-IBD (n = 28), inactive UC (n = 30) and active UC (n = 16) is illustrated as well as colonic luminal fluid processing to the final soluble and pelletable effector fractions (SEF and PEF). Created in BioRender. Fleischhacker, D. (2025) https://BioRender.com/y93dulo. b Relevant clinical parameters of the non-IBD control group and UC group, which was further divided into the inactive and active UC groups based on Mayo endoscopic subscore. Data is presented as absolute number/ percentage of patients or as median (25th–75th percentile). Abbreviations as follows: BMI body mass index, OBPQS Ottawa Bowel Preparation Quality Scale, 5-ASA 5-aminosalicylic acid. c, d Total protein biomass determined by Bradford for the isolated soluble and pelletable effector fractions (SEF and PEF) of the three groups, i.e., non-IBD (blue), inactive UC (yellow), and active UC (red). PEF values are presented as the protein biomass back-calculated to the original colonic luminal samples to eliminate the 100-fold concentration during fractionation. e Nanoparticle amount determined by nanoparticle tracking analysis (NTA) for the pelletable effector fractions of the three groups, i.e., non-IBD (blue), inactive UC (yellow) and active UC (red). f Mean and mode nanoparticle diameters determined by nanoparticle tracking analysis (NTA) for the pelletable effector fractions of the three groups, i.e., non-IBD (blue), inactive UC (yellow) and active UC (red). cf Data is presented as median ± interquartile range. Statistical difference between the three groups was evaluated by Kruskal–Wallis with Dunn’s test. bf Source data are provided as a Source Data file.
Fig. 2
Fig. 2. Identification of a pro-inflammatory property in EV fractions derived from UC patients.
a IL-8 response in HT-29 human intestinal epithelial cells exposed to soluble effector (SEF, left) and extracellular vesicle (EV, right) fractions of the non-IBD (blue), inactive UC (yellow) and active UC (red) group. b IgA titers in soluble effector (SEF, left) and extracellular vesicle (EV, right) fractions of the non-IBD (blue), inactive UC (yellow), and active UC (red) group. c IgG titers in soluble effector (SEF, left) and extracellular vesicle (EV, right) of the non-IBD (blue), inactive UC (yellow), and active UC (red) group. d sCD89-IgA complex levels in soluble effector (SEF, left) and extracellular vesicle (EV, right) fractions of the non-IBD (blue), inactive UC (yellow), and active UC (red) group. e Representative images showing immunofluorescent stainings of human colonic biopsies derived from a non-IBD, inactive UC, and active UC patient for CD89 (red), immune cell marker CD68 (green) and total nuclei stained with DAPI (blue). Graph on the right side depicts the number of CD89+CD68+ and CD89+CD68dim/- cells per eye field for independent biopsies (non-IBD, n = 9; inactive UC, n = 10; active UC, n = 12). Scale bar = 50 µm. Data in graphs is presented as median ± interquartile range. Statistical difference against the non-IBD group was evaluated by Kruskal–Wallis with Dunn’s test. f IL-8 response in CD89+CD14+CD11b+ U937 monocytes exposed to soluble effector (SEF, left) and extracellular vesicle (EV, right) fractions of the non-IBD (blue), inactive UC (yellow) and active UC (red) group. g IL-6 response in the in CD89+CD14+CD11b+ U937 monocytes exposed to soluble effector (SEF, left) and extracellular vesicle (EV, right) of the non-IBD (blue), inactive UC (yellow) and active UC (red) group. ad, f, g sample number as follows: non-IBD (n = 28), inactive UC (n = 30) and active UC (n = 16). Data is presented as median ± interquartile range. Samples with no detectable signal were set to the limit of detection, which is indicated by a dotted line. Statistical difference between the three groups was evaluated by Kruskal–Wallis with Dunn’s test. ag Source data are provided as a Source Data file.
Fig. 3
Fig. 3. Pro-inflammatory properties of EV fractions derived from UC patients are confirmed in human intestinal organoid-derived monolayers and CD14+ human monocytes.
a Flow cytometry analysis including gating strategy of human intestinal organoids testing for CD89 expression. b Flow cytometry analysis of human monocytes isolated from peripheral blood for CD14, CD11b and CD89 expression. c IL-8 response in CD89-negative human intestinal organoid-derived monolayers from two healthy donors exposed to extracellular vesicle (EV) fractions derived from the non-IBD (blue) and active UC (red) group (randomly chosen representatives). Lack of CD89 expression was confirmed by FACS provided in panel a. Data is presented as median ± interquartile range (n = 6 for donor 2 exposed to active UC; n = 5 for all other data sets). d IL-8 (left) and IL-6 (right) response in CD14+ human monocytes isolated from three healthy donors exposed to extracellular vesicle (EV) fractions derived from the non-IBD (blue) and active UC (red) group (randomly chosen representatives). CD89 expression was confirmed by FACS analysis provided in (b). Data is presented as median ± interquartile range (n = 8 for donor 1 and 3; n = 5 for donor 2). c, d Statistical difference between non-IBD and active UC groups was evaluated by two-sided Mann–Whitney U-test. Source data are provided as a Source Data file.
Fig. 4
Fig. 4. Detection of IgA-coated BEVs in human EV fractions.
a Shown are electron micrographs of EV fractions derived from UC patients (randomly chosen representatives), IgA-coated BEVs from B. fragilis and L. acidophilus (IgA-BEVsB/L) and uncoated BEVs from B. fragilis and L. acidophilus (BEVsB/L) after immunogold co-staining for human IgA (20 nm gold particles, black arrow) and the bacterial vesicle biomarkers LTA and OmpA (6 nm gold particles, white arrow). Representative examples of EVs from active UV patients and IgA-BEVsB/L show presence of both immunogold particles on the vesicles. Absence of immunogold particles in uncoated BEVs from B. fragilis and L. acidophilus (BEVsB/L) excludes cross-reactivity of the immunogold-conjugated anti-human IgA antibody. The experiments were repeated at least 3 times with a similar result. Scale bars, 100 nm for overview images and 10 nm for the magnified sections. b Summarized results from the nanoparticle tracking analysis (NTA) of EV fractions derived from active UC patients (five randomly chosen representatives), uncoated and IgA-coated BEVs from B. fragilis and L. acidophilus (BEVB/L and IgA-BEVB/L) after labeling with rabbit anti-human IgA antibody and Alexa Fluor Plus 488- conjugated goat anti-rabbit IgG. For each sample nanoparticle amounts were measured in the conventional light scattering and fluorescent mode. Data is presented as median ± interquartile range (active UC EV fractions, n = 5; IgA-BEVsB/L and BEVsB/L, n = 3). Samples with no detectable signal were set to the limit of detection, which is indicated by a dotted line. c Summarized LTA detection results from the nanoparticle tracking analysis (NTA) of EV fractions derived from active UC patients (three randomly chosen representatives UC1, UC2 and UC3) before and after immunoprecipitation. Samples were labeled with anti-LTA primary antibody and Alexa Fluor Plus 488 secondary antibody and subjected to NTA. For each sample nanoparticle amounts were measured in the conventional light scattering and fluorescent mode. Labeling efficiency (%) of each sample was calculated by dividing the fluorescent particle number to total particle number determined by scattering mode multiplied by 100. Results of 10 measurements for each sample are presented as median ± interquartile range (n = 10). Statistical difference between before and after immunoprecipitation was evaluated by two-sided Mann–Whitney U-test. d Heat map highlighting the enrichment of bacterial proteins (primary Uniprot accession number) in EV fractions derived from active UC patients after anti-human IgA immunoprecipitation. EV fractions derived from three randomly chosen active UC patients (UC1, UC2, and UC3) were subjected to an immunoprecipitation using an anti-human IgA antibody. Original EV fractions and immunoprecipitated samples were subjected to proteomic analyses. A few surface proteins covering were selected as BEV markers and analyzed as detailed in the method section. Relative abundance in percentile of each protein was assigned with a color code as indicated in the bar on the right side. e LTA-IgA (left) and OmpA-IgA (right) effector complex levels in extracellular vesicle (EV) fractions of the non-IBD (blue, n = 28) and active UC (red, n = 16) group. In the ELISA strategy, anti-LTA or anti-OmpA were used as coating antibodies to capture BEVs in the EV fractions, followed by HRP-conjugated anti-human IgA as detection antibody to quantify the IgA bound to BEVs. Data is presented as median ± interquartile range. Samples with no detectable signal were set to the limit of detection, which is indicated by a dotted line. Statistical difference between non-IBD and active UC groups was evaluated by two-sided Mann–Whitney U-test. be, Source data are provided as a Source Data file.
Fig. 5
Fig. 5. IgA-coated BEVs promote pro-inflammatory cytokine release in CD89+ cells.
a IL-8 response in CD89+CD14+CD11b+ U937 monocytes exposed to uncoated or IgA-coated BEVs from B. fragilis and L. acidophilus (BEVsB/L and IgA-BEVsB/L), uncoated or IgA-coated hEVs or soluble IgA alone. Dosage of the effector samples given by total protein biomass determined by Bradford is indicated. Incubation with saline served as mock-treated control (co). (n = 10 for each data set). b IL-6 response in CD89+CD14+CD11b+ U937 monocytes exposed to uncoated or IgA-coated BEVs from B. fragilis and L. acidophilus (BEVsB/L and IgA-BEVsB/L), uncoated or IgA-coated hEVs or soluble IgA alone. Dosage of the effector samples given a total protein biomass determined Bradford is indicated. Incubation with saline served as mock-treated control (co). (n = 8 for uncoated hEVs; all other data sets n = 9). c IL-8 response in CD89-negative human intestinal organoid-derived monolayers from two healthy donors exposed to 5 µg uncoated or IgA-coated BEVs from B. fragilis and L. acidophilus (BEVsB/L and IgA-BEVsB/L). Lack of CD89 expression was confirmed by FACS (Fig. 3a). Data is presented as median ± interquartile range (n = 5 for each data set). d IL-8 (left) and IL-6 (right) response in CD14+ human monocytes isolated from three healthy donors exposed to 5 µg uncoated or IgA-coated BEVs from B. fragilis and L. acidophilus (BEVsB/L and IgA-BEVsB/L). CD89 expression was confirmed by FACS analysis (Fig. 3b). Data is presented as median ± interquartile range (n = 4 for donor 1, n = 5 for donor 2, and n = 7 for donor 3). ad Data is presented as median ± interquartile range. Samples with no detectable signal were set to the limit of detection, which is indicated by a dotted line. Statistical difference between uncoated and IgA-coated BEVs was evaluated by two-sided Mann–Whitney U-test. Source data are provided as a Source Data file.
Fig. 6
Fig. 6. IgA-coated BEVs and EV fractions from UC patients promote a CD89-dependent pro-inflammatory cytokine release in mouse bone marrow derived cells (BMDC).
a IL-6 and TNF-α response in bone marrow derived cells (BMDC) from CD89wt/wt (littermates, LM) and CD89tg/wt (CD89-transgenic, CD89) mice exposed to uncoated or IgA-coated BEVs from B. fragilis and L. acidophilus (BEVsB/L and IgA-BEVsB/L) as well as soluble IgA alone. Dosage of the effector samples given by total protein biomass determined by Bradford is indicated. Incubation with saline served as mock-treated control (co). (n = 10 for each data set). b IL-6 and TNF-α response in bone marrow derived cells (BMDC) from CD89tg/wt (CD89-transgenic, CD89) mice exposed to 1 µg IgA-coated BEVs from B. fragilis and L. acidophilus (IgA-BEVsB/L) in the absence (-) or presence (+) of the Syk inhibitor R406. (n = 6 for each data set). c IL-6 (left) and TNF-α (right) response in bone marrow derived cells (BMDC) from CD89wt/wt (littermates, LM) and CD89tg/wt (CD89-transgenic, CD89) mice exposed to EV fractions derived from the non-IBD (blue) and active UC (red) group (seven randomly chosen representatives). (n = 7 for each data set). d IL-6 and TNF-α response in bone marrow derived cells (BMDC) from CD89tg/wt (CD89-transgenic, CD89) mice exposed to 1 µg EV fractions derived from three representative active UC patients (UC1, UC2, or UC3) in the absence (-) or presence (+) of the Syk inhibitor R406. (n = 4 for each data set). ad Data is presented as median ± interquartile range. Samples with no detectable signal were set to the limit of detection, which is indicated by a dotted line. Statistical difference in panel a was evaluated by Kruskal–Wallis (comparison of groups receiving the same BEVsB/L dosage) with Dunn’s test. Statistical differences in all other panels [comparison of (B)EV samples with and without inhibitor or non-IBD and active UC groups] were evaluated by two-sided Mann–Whitney U-test. Source data are provided as a Source Data file.
Fig. 7
Fig. 7. IgA-coated BEVs exacerbate DSS-induced colitis in CD89+ mice.
a Timeline of the DSS treatment of CD89wt/wt (littermates, LM) and CD89tg/wt (CD89-transgenic, CD89) mice followed by oral gavage with uncoated or IgA-coated BEVs from B. fragilis and L. acidophilus (BEVsB/L and IgA- BEVsB/L). Oral gavage with saline served as mock-treated control (co). Created in BioRender. Fleischhacker, D. (2025) https://BioRender.com/hbvosjv. b Colon length determined along endpoint harvest (day 9). c Colon histopathology scores assessed double-blinded from colon harvested at the endpoint (day 9). Scores are the sum of the individual criteria assessment including epithelial alteration, neutrophil infiltration and erosion assigned as follows: 0, absent; 1, focal; 2, present; 3, abundant. d Lipocalin-2 levels determined by ELISA from cecal content harvested at the endpoint (day 9). bd Data is presented as box plot showing minimum and maximum (whiskers), interquartile range (bounds of the box), median (center) (n = 10 mice/group). Statistical difference was evaluated by Kruskal–Wallis (CD89-transgenic mice receiving IgA-coated BEVsB/L to all other groups) with Dunn’s test. Source data are provided as a Source Data file. e Representative histology pictures from heamotoxylin and eosin stained colons derived from CD89wt/wt (littermates, LM) and CD89tg/wt (CD89-transgenic, CD89) mice receiving saline, uncoated or IgA-coated BEVs from B. fragilis and L. acidophilus (BEVsB/L and IgA- BEVsB/L) harvested at the endpoint (day 9). Note that CD89-transgenic mice exhibit intensive neutrophil infiltration, epithelial alteration and erosions, whereas littermates showed no or only minimal signs of inflammation. The experiments were repeated at least 10 times with a similar result. Scale bar = 100 µm. f Representative images showing immunofluorescent stainings of colon tissue derived from CD89wt/wt (littermates, LM) and CD89tg/wt (CD89-transgenic, CD89) mice receiving IgA-coated BEVsB/L harvested at the endpoint (day 9). Tissue specimen were stained with anti-human CD89 (red), anti-mouse CD11b (green) and total nuclei stained with DAPI (blue). The experiments were repeated at least 3 times with a similar result. Scale bar = 50 µm.

References

    1. Torres, J., Billioud, V., Sachar, D. B., Peyrin-Biroulet, L. & Colombel, J. F. Ulcerative colitis as a progressive disease: the forgotten evidence. Inflamm. Bowel Dis.18, 1356–1363 (2012). - PubMed
    1. Ungaro, R., Mehandru, S., Allen, P. B., Peyrin-Biroulet, L. & Colombel, J. F. Ulcerative colitis. Lancet389, 1756–1770 (2017). - PMC - PubMed
    1. Kobayashi, T. et al. Ulcerative colitis. Nat. Rev. Dis. Prim.6, 74 (2020). - PubMed
    1. Le Berre, C., Honap, S. & Peyrin-Biroulet, L. Ulcerative colitis. Lancet402, 571–584 (2023). - PubMed
    1. Bokemeyer, B., Picker, N., Kromer, D., Rosin, L. & Patel, H. Rates of clinical remission and inadequate response to advanced therapies among patients with ulcerative colitis in Germany. Int J. Colorectal Dis.38, 116 (2023). - PMC - PubMed

MeSH terms

LinkOut - more resources