

Characteristics of leaf nutrient resorption efficiency in Tibetan alpine permafrost ecosystems
- PMID: 40301364
- PMCID: PMC12041207
- DOI: 10.1038/s41467-025-59289-x
Characteristics of leaf nutrient resorption efficiency in Tibetan alpine permafrost ecosystems
Abstract
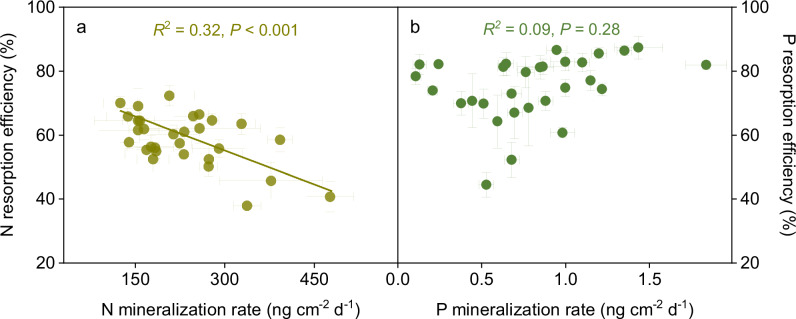
Nutrient resorption is an important strategy for nutrient conservation, especially in permafrost ecosystems where plant growth is limited by nutrients. Based on the measurements mainly derived from tropical, subtropical and temperate regions, current projections suggest that resorption efficiency is higher for leaf nitrogen (N) than for phosphorus (P) in cold regions. However, these projections have not been fully validated due to the lack of observations in permafrost ecosystems. Here, we carry out a large-scale sampling campaign along a permafrost transect on the Tibetan Plateau. Our results show that, in contrast with the prevailing view, resorption efficiency is higher for leaf P than N in permafrost ecosystems (75.1 ± 1.8% vs. 58.7 ± 1.5%; mean ± standard error). Our results also reveal that leaf P resorption efficiency is higher in permafrost ecosystems than in global herbaceous plants, while there is no difference for leaf N resorption efficiency. Interestingly, there is a trade-off between leaf N resorption efficiency and soil N mineralization rate, but no such pattern exists for P. These results illustrate the unique characteristics of plant nutrient resorption in permafrost ecosystems and advance our understanding of nutrient conservation strategies in little-studied permafrost regions.
© 2025. The Author(s).
Conflict of interest statement
Competing interests: The authors declare no competing interests.
Figures


Similar articles
-
Divergent responses of nutrient biogeographical patterns in different shrub types across the arid region of Qinghai-Tibet Plateau.BMC Plant Biol. 2024 Nov 29;24(1):1150. doi: 10.1186/s12870-024-05849-0. BMC Plant Biol. 2024. PMID: 39609788 Free PMC article.
-
Foliar nutrient resorption patterns of four functional plants along a precipitation gradient on the Tibetan Changtang Plateau.Ecol Evol. 2017 Aug 2;7(18):7201-7212. doi: 10.1002/ece3.3283. eCollection 2017 Sep. Ecol Evol. 2017. PMID: 28944011 Free PMC article.
-
Effects of climate, soil, and leaf traits on nutrient resorption efficiency and proficiency of different plant functional types across arid and semiarid regions of northwest China.BMC Plant Biol. 2024 Nov 19;24(1):1093. doi: 10.1186/s12870-024-05794-y. BMC Plant Biol. 2024. PMID: 39558226 Free PMC article.
-
Variability and limits of nitrogen and phosphorus resorption during foliar senescence.Plant Commun. 2023 Mar 13;4(2):100503. doi: 10.1016/j.xplc.2022.100503. Epub 2022 Dec 13. Plant Commun. 2023. PMID: 36514281 Free PMC article. Review.
-
Responses of forest ecosystems to increasing N deposition in China: A critical review.Environ Pollut. 2018 Dec;243(Pt A):75-86. doi: 10.1016/j.envpol.2018.08.010. Epub 2018 Aug 9. Environ Pollut. 2018. PMID: 30172126 Review.
Cited by
-
Variation in Community Leaf Stoichiometry and Nutrient Resorption Along an Elevational Gradient on the Northern Slope of the Kunlun Mountains.Ecol Evol. 2025 Aug 29;15(9):e72083. doi: 10.1002/ece3.72083. eCollection 2025 Sep. Ecol Evol. 2025. PMID: 40896109 Free PMC article.
References
-
- Du, E. et al. Global patterns of terrestrial nitrogen and phosphorus limitation. Nat. Geosci.13, 221–226 (2020).
-
- Lebauer, D. S. & Treseder, K. K. Nitrogen limitation of net primary productivity in terrestrial ecosystems is globally distributed. Ecology89, 371–379 (2008). - PubMed
-
- Hou, E. et al. Latitudinal patterns of terrestrial phosphorus limitation over the globe. Ecol. Lett.24, 1420–1431 (2021). - PubMed
MeSH terms
Substances
Grants and funding
LinkOut - more resources
Full Text Sources
