

Order-disorder phase transition of cell membrane induced by THz irradiation
- PMID: 40301493
- PMCID: PMC12041452
- DOI: 10.1038/s41598-025-99475-x
Order-disorder phase transition of cell membrane induced by THz irradiation
Abstract
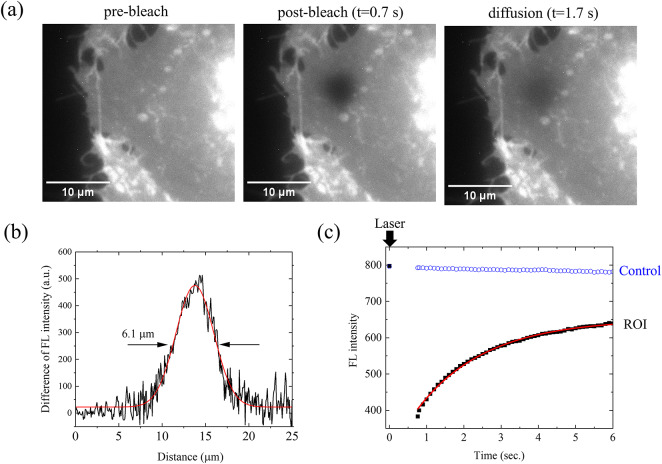
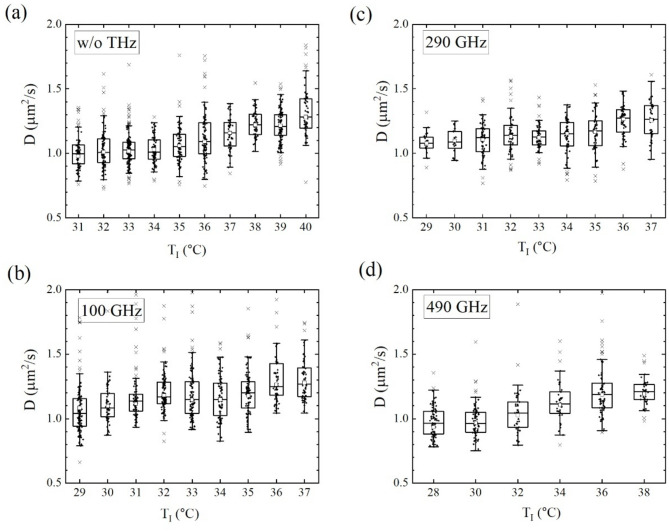
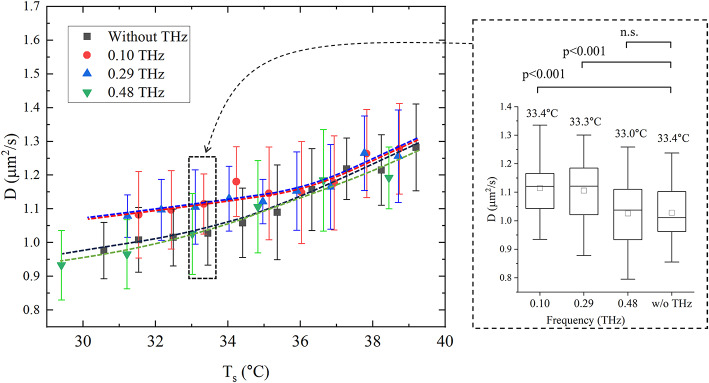
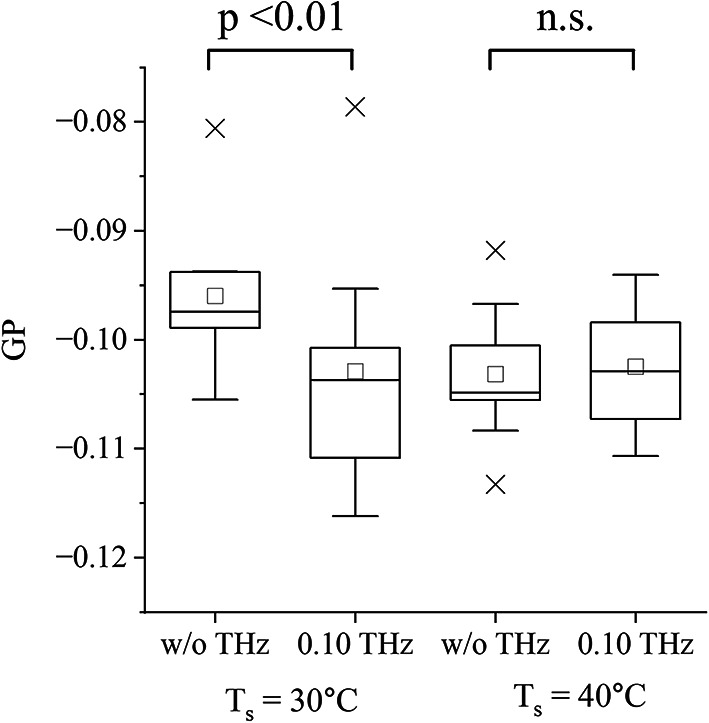
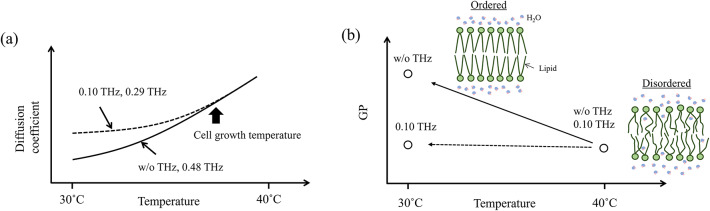
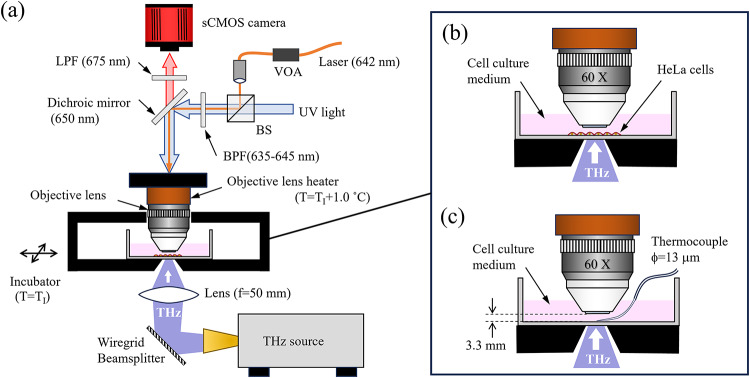
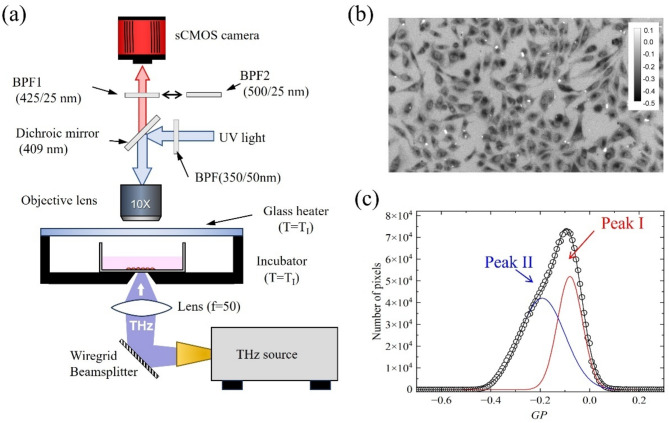
To elucidate the mechanism by which THz radiation non-thermally affects living organisms, the lateral diffusion constants of lipid molecules in the cell membranes of HeLa cells were measured using fluorescence recovery after photobleaching under THz wave irradiation (THz-FRAP) at frequencies of 0.10, 0.29, and 0.48 THz, with power densities ranging from 20 to 89 mW/cm2. The potential heating effects of the THz irradiation were eliminated through temperature calibration using an ultrathin thermocouple, allowing for the investigation of the non-thermal effects of THz radiation. Irradiation at 0.10 and 0.29 THz induced an increase in diffusion constants at temperatures lower than the cell growth temperature, indicating fluidity of the cell membrane is enhanced by the THz irradiation. We also performed Laurdan fluorescence imaging for HeLa cells to observe change of membrane dynamics under THz irradiation. The red shifting of the fluorescence emission indicates that THz irradiation induces the order-disorder phase transition of the cell membrane lipids by affecting the dynamics of bound water molecules. Our findings have important implications for the establishment of safety standards for THz radiation and for the potential development of new methods for cell manipulation using THz irradiation in the future.
© 2025. The Author(s).
Conflict of interest statement
Declarations. Competing interests: The authors declare no competing interests.
Figures
Similar articles
-
THz irradiation inhibits cell division by affecting actin dynamics.PLoS One. 2021 Aug 2;16(8):e0248381. doi: 10.1371/journal.pone.0248381. eCollection 2021. PLoS One. 2021. PMID: 34339441 Free PMC article.
-
Using fluorescence recovery after photobleaching to measure lipid diffusion in membranes.Methods Mol Biol. 2007;400:267-75. doi: 10.1007/978-1-59745-519-0_18. Methods Mol Biol. 2007. PMID: 17951740
-
In vivo analysis of THz wave irradiation induced acute inflammatory response in skin by laser-scanning confocal microscopy.Opt Express. 2014 May 19;22(10):11465-75. doi: 10.1364/OE.22.011465. Opt Express. 2014. PMID: 24921268
-
Disorder Amidst Membrane Order: Standardizing Laurdan Generalized Polarization and Membrane Fluidity Terms.J Fluoresc. 2017 Jan;27(1):243-249. doi: 10.1007/s10895-016-1951-8. Epub 2016 Oct 13. J Fluoresc. 2017. PMID: 27738919 Review.
-
Methods to measure the lateral diffusion of membrane lipids and proteins.Methods. 2006 Jun;39(2):147-53. doi: 10.1016/j.ymeth.2006.05.008. Methods. 2006. PMID: 16846741 Review.
References
-
- Peiponen, K. E., Zeitler, A. & Kuwata-Gonokami, M. Terahertz Spectroscopy and Imaging. Vol. 171. (Springer Berlin Heidelberg, 2013).
-
- Markelz, A. G. & Mittleman, D. M. Perspective on Terahertz tpplications in bioscience and biotechnology. ACS Photonics9, 1117–1126 (2022).
-
- Mourad, A., Yang, R. & Lehne, P. H. De La Oliva, A. A baseline roadmap for advanced wireless research beyond 5G. Electron. Switz.9, 1–14 (2020).
-
- Giordani, M., Polese, M., Mezzavilla, M., Rangan, S. & Zorzi, M. Toward 6G networks: use cases and technologies. IEEE Commun. Mag. 58, 55–61 (2020).
-
- Lien, J. et al. Soli: ubiquitous gesture sensing with millimeter wave radar. ACM Trans. Graph35, 1–19 (2016).
MeSH terms
Substances
Grants and funding
LinkOut - more resources
Full Text Sources
Miscellaneous
