. 2025 Aug;44(29):2490-2503.
doi: 10.1038/s41388-025-03415-y. Epub 2025 Apr 30.

β-Catenin interacts with canonical RBPs including MSI2 to associate with a Wnt signalling mRNA network in myeloid leukaemia cells

Affiliations

β-Catenin interacts with canonical RBPs including MSI2 to associate with a Wnt signalling mRNA network in myeloid leukaemia cells

M Wagstaff et al. Oncogene. 2025 Aug.

Abstract

Wnt/β-catenin signalling is important for normal hematopoietic stem/progenitor cell (HSPC) biology and heavily implicated in acute and chronic myeloid leukaemia (AML and CML). The central mediator β-catenin is an attractive therapeutic target in myeloid neoplasms however its targeting has been hampered by a poor characterisation of its molecular interactions in haematopoietic cells, which will differ from its network in solid tissues. Our previous β-catenin interactome study identified the significant enrichment of RNA-binding proteins (RBP) implying post-transcriptional roles for β-catenin in myeloid cells. To identify β-catenin interacting mRNAs we performed β-catenin RNA-immunoprecipitation coupled to RNA-sequencing (RIP-seq) and identified significantly enriched Wnt signalling pathway transcripts. Using β-catenin cross-linking immunoprecipitation (CLIP) we demonstrated a limited capacity for β-catenin to bind RNA directly, implying dependence on other RBPs. β-Catenin was found to interact with Musashi-2 (MSI2) in both myeloid cell lines and primary AML patient samples, where expression was significantly correlated. MSI2 knockdown reduced Wnt signalling output (TCF/LEF activity), through suppression of LEF-1 expression and nuclear localisation. Through both RIP and CLIP we demonstrate MSI2 binds LEF1 mRNA in a partly β-catenin dependent fashion, and may impact the post-transcriptional control of LEF-1 expression. Finally, we show that MSI2-mediated expansion of human HSPCs could be partly driven through LEF1 regulation. This is the first study to experimentally demonstrate functional crosstalk between MSI2 and Wnt signalling in human cells, and indicates potential novel post-transcriptional roles for β-catenin in a haematological context.


Conflict of interest statement

Competing interests: The authors declare no competing interests.

Figures

Fig. 1
Fig. 1. β-Catenin RIP enriches with RNA from myeloid cells.
A Immunoblot showing HuR levels in HuR RIP performed from K562 cells. B Graph summarising the fold enrichment ACTB mRNA (known HuR binding target) [82] obtained from RT-qPCR analysis of IgG or HuR RIP analysis from K562 cells (n = 3) C Representative immunoblot showing β-catenin level obtained from β-catenin RIPs performed from K562 cells (±CHIR99021), ID = immunodepleted lysate. D Agilent 2100 Bioanalyzer gel showing RNA isolated from IgG or β-catenin RIP performed from K562 cells (±CHIR99021).
Fig. 2
Fig. 2. β-Catenin RIP enriches with Wnt signalling mRNAs.
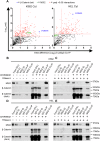
Volcano plots showing the fold change in mRNA abundance detected within β-catenin RIP performed from DMSO (basal Wnt signalling) versus CHIR99021 (activated Wnt signalling) treated A K562 or B HEL cells (n = 3). Red dots represent enriched (Padj < 0.05) mRNAs whilst blue dots highlight Wnt signalling mRNAs and black dots highlight metabolic mRNAs. C Venn diagram illustrating the unique and shared mRNAs partners identified from β-catenin RIP performed from CHIR99021 versus DMSO treated K562 or HEL cells. D Gene ontology (GO) analysis using the human Molecular Signatures Database (Elsevier Pathway Collection) via Enrichr for pathways represented amongst the most significantly and commonly enriched mRNAs (Padj < 0.05), obtained in β-catenin RIP from K562 and HEL cells ±CHIR99021 with adjusted −Log10 P values annotated. Summary graphs showing the fold enrichment of selected Wnt signalling mRNAs isolated from IgG or β-catenin RIP-RT-qPCR performed in E K562 and F HEL cells. Data represents mean ± 1 s.d (n = 3). Statistical analysis is denoted by *p < 0.05 and **p < 0.01 as deduced from a one-sample t-test.
Fig. 3
Fig. 3. β-Catenin CLIP does not enrich with RNA from myeloid cells.
A Representative immunoblot showing β-catenin level in IgG or β-catenin CLIP performed from K562 cells using 1 h or 16 h primary antibody incubation, ID = immunodepleted lysate. B Representative Agilent 2100 Bioanalyzer gel showing RNA isolated from IgG, β-catenin or LIN28B RIP and CLIP performed in K562 cells. C Summary graph indicating the RNA concentration isolated from IgG or β-catenin RIP and CLIP. Data represent mean ± SEM (n = 3 for CLIP, n = 8 for RIP). Statistical analysis is denoted by *p < 0.05 as deduced from a student’s t test.
Fig. 4
Fig. 4. β-Catenin interacts with MSI2 in myeloid cells.
A Scatter plots showing MSI2 detection in β-catenin interactomes performed in cytosolic fractions of K562 and HEL cells. Vertical dashed red line indicates the threshold for 2-fold change in protein binding at log2 (=1) relative to IgG Co-IP. The horizontal red line represents threshold for p < 0.05 on log10 scale (=1.3). Highlighted red dots indicate enriched interactions (p < 0.05), green labels highlight position of MSI2, and blue labels highlight position of β-catenin bait. Representative immunoblots showing the level of β-catenin protein present in MSI2 Co-IPs derived from B K562 - RNase A, C K562 + 20 µg/mL RNaseA, D HEL - RNase A and E HEL + 20 µg/mL RNaseA whole cell lysates, ±5µM CHIR99021 overnight. ID immunodepleted lysate.
Fig. 5
Fig. 5. MSI2 and β-catenin correlate and interact in primary AML patient samples.
A Immunoblot of 18 myeloid leukaemia cell lines showing the relative level of β-catenin and MSI2 protein, with GAPDH used to assess protein loading. B Summary scatter plot showing the correlation (Spearman Rank R = 0.6, P < 0.03) between relative β-catenin and MSI2 protein expression across 18 myeloid cell lines as deduced from densitometry (normalised to GAPDH expression present within each cell line, AU = arbitrary units). C Immunoblot screen of 20 primary AML patient samples showing the relative level of β-catenin and MSI2 protein (light and dark exposures). * Denotes samples co-overexpressing both β-catenin and MSI2 relative to levels in CB MNC and CB CD34+ enriched fraction (pooled from five independent CB samples). X = Void sample containing no protein as deduced from negative GAPDH detection. D Summary scatter plot showing the correlation (Spearman Rank R = 0.79, P < 0.0001) between relative β-catenin and MSI2 protein expression across 20 primary AML patient samples as deduced from densitometry (normalised to GAPDH expression present in each sample, AU = arbitrary units). E Immunoblot showing the level of β-catenin and GAPDH protein present in an MSI2 Co-IP performed from primary AML patient sample #10 of sample screen.
Fig. 6
Fig. 6. MSI2 knockdown impairs Wnt signalling output through LEF-1 modulation.
A Immunoblots showing MSI2, β-catenin and LEF1 level in K562 and KU812 cells harbouring MSI2 shRNA or non-targeting shRNA controls. GAPDH indicates protein loading. B Representative flow cytometric histograms showing intensity of the TCF-dependent expression of Venus Yellow Fluorescent Protein (YFP) from the β-catenin activated reporter (BAR) reporter, or negative control ‘found unresponsive’ BAR (fuBAR; containing mutated promoter binding sites) in K562 and KU812 cells ± MSI2 shRNA following treatment with 5 μM CHIR99021 overnight. The fuBAR (dashed), non-targeting control shRNA (grey filled), and two MSI2 shRNAs (blue or red) histograms are shown. Summary graphs showing the median fluorescence intensity (MFI) generated from the BAR/fuBAR in C K562 and D KU812 cells ±MSI2 shRNA with ±5 μM CHIR99021. E Immunoblots showing total β-catenin, LEF-1, and MSI2 subcellular localisation in K562 and KU812 cells lentivirally transduced with two different MSI2 shRNAs ±5 μM CHIR99021. Lamin A/C and α-tubulin indicate the purity/loading of the nuclear (N) and cytosol (C) fractions respectively. Densitometric quantitation of LEF-1 (relative to nuclear Lamin A/C, AU = arbitrary units) present in nuclear fractions of F K562 and G KU812 cells ± MSI2 shRNA with ±5 μM CHIR99021. Summary graph showing the fold change in LEF1 and TCF7L2 mRNA expression as assessed by RT-qPCR in (H) K562 and (I) KU812 cells expressing MSI2 shRNA relative to non-targeting control shRNA (represented by dotted line at y = 1). Fold change is relative to matched respective controls (black dashed line) and overall expression was normalised to the housekeeping gene β-actin (ACTB). Data represent mean ± 1 s.d (n = 3). Statistical analysis is denoted by *p < 0.05, **p < 0.01, ***p < 0.001 and ****p < 0.0001 as deduced from a student’s t test or one-sample t-test for RT-qPCR data.
Fig. 7
Fig. 7. MSI2 regulates LEF-1 expression and binds LEF1 in a partly β-catenin-dependent fashion.
A Immunoblot showing MSI2 level in MSI2 RIP performed from K562 cells. ID= immunodepleted lysate. Summary graphs showing the fold enrichment of TCF7L2, MYC, MYB, and LEF1 mRNA in MSI2 B RIP and C CLIP performed from K562 cells. Fold enrichment is relative to matched IgG RIPs (dashed black line). D Immunoblots showing MSI2 and β-catenin levels in K562 cell lines harbouring β-catenin shRNAs versus non-targeting shRNA control. GAPDH indicates protein loading. Summary graphs showing the fold change in LEF1 mRNA expression in input K562 cells harbouring β-catenin shRNA versus non-targeting shRNA control (dashed black line) used for E MSI2 RIP and F) MSI2 CLIP. Summary graphs showing the fold enrichment of LEF1 mRNA (versus IgG RIP) in MSI2 G) RIP and H CLIP generated from K562 cells ± β-catenin shRNAs. I Line graph summarising the fold change in LEF1 mRNA expression (relative to T = 0 h for each respective cell line) in K562 cells harbouring MSI2 shRNA (red) versus non-targeting shRNA control (black) treated with 2 µg/ml ActD for indicated times. J Immunoblot showing the levels of MSI2, β-catenin, and LEF-1 protein in K562 cells ±MSI2 shRNA with treatment of 2 µg/ml ActD for indicated timepoints. Data represents mean ± 1 s.d (n = 3). Statistical analysis is denoted by *p < 0.05 and **p < 0.01 as deduced from a student’s t-test.
Fig. 8
Fig. 8. MSI2-mediated human HSPC expansion is partly mediated through LEF-1.
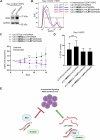
A Immunoblot showing the level of MSI2 in day 4 primary CB-derived HSPC cultures following 3 days post lentiviral transduction with empty vector (EV) or human MSI2. GAPDH indicates protein loading. B Representative day 4 flow cytometric histogram plots showing percentage GFP+ events in primary HSPC cultures lentivirally transduced with ectopic MSI2 ± LEF-1 or non-targeting (NT) shRNA, versus matched untransduced cells. C Line graph showing the fold-expansion of HSPC cultures following lentiviral transduction with ectopic MSI2 ± LEF-1 shRNAs. D Bar graph showing the relative percentage of CD34+ events in day 8 HSPC liquid cultures following lentiviral transduction with ectopic MSI2 ± LEF-1 shRNAs. All data represent mean ± 1 s.d (n = 3, each replicate pooled from multiple donors). Statistical analysis is denoted by *p < 0.05 and **p < 0.01 as deduced from a student’s t test. E Graphical summary depicting how the β-catenin:MSI2 axis could regulate LEF-1 expression and subsequent growth/survival of human HSPC.

Similar articles

Cited by

References

    1. Nusse R, Clevers H. Wnt/beta-catenin signaling, disease, and emerging therapeutic modalities. Cell. 2017;169:985–99. 10.1016/j.cell.2017.05.016. - PubMed
    1. Reya T, Duncan AW, Ailles L, Domen J, Scherer DC, Willert K, et al. A role for Wnt signalling in self-renewal of haematopoietic stem cells. Nature. 2003;423:409–14. - PubMed
    1. Danek P, Kardosova M, Janeckova L, Karkoulia E, Vanickova K, Fabisik M, et al. beta-Catenin-TCF/LEF signaling promotes steady-state and emergency granulopoiesis via G-CSF receptor upregulation. Blood. 2020;136:2574–87. 10.1182/blood.2019004664. - PMC - PubMed
    1. Brown AL, Salerno DG, Sadras T, Engler GA, Kok CH, Wilkinson CR, et al. The GM-CSF receptor utilizes beta-catenin and Tcf4 to specify macrophage lineage differentiation. Differentiation. 2012;83:47–59. 10.1016/j.diff.2011.08.003. - PMC - PubMed
    1. Shooshtarizadeh P, Helness A, Vadnais C, Brouwer N, Beauchemin H, Chen R, et al. Gfi1b regulates the level of Wnt/beta-catenin signaling in hematopoietic stem cells and megakaryocytes. Nat Commun. 2019;10:1270. 10.1038/s41467-019-09273-z. - PMC - PubMed

MeSH terms