. 2025 Jun;31(6):2016-2026.
doi: 10.1038/s41591-025-03625-7. Epub 2025 Apr 29.

Broad rim lesions are a new pathological and imaging biomarker for rapid disease progression in multiple sclerosis

Affiliations

Broad rim lesions are a new pathological and imaging biomarker for rapid disease progression in multiple sclerosis

Luisa Klotz et al. Nat Med. 2025 Jun.

Abstract

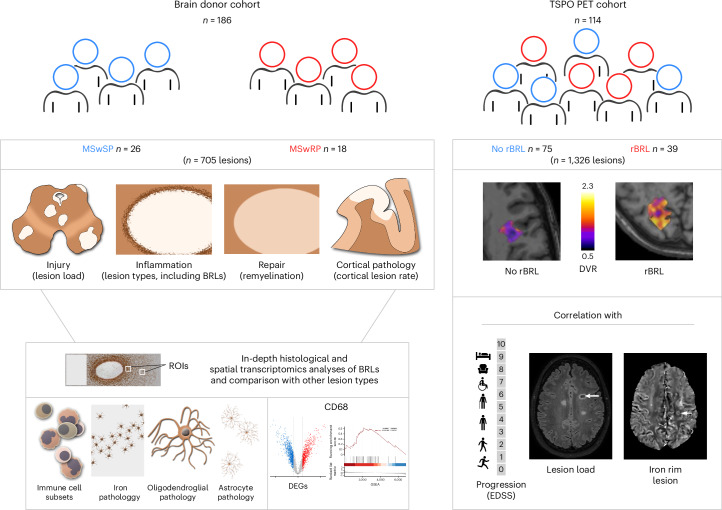
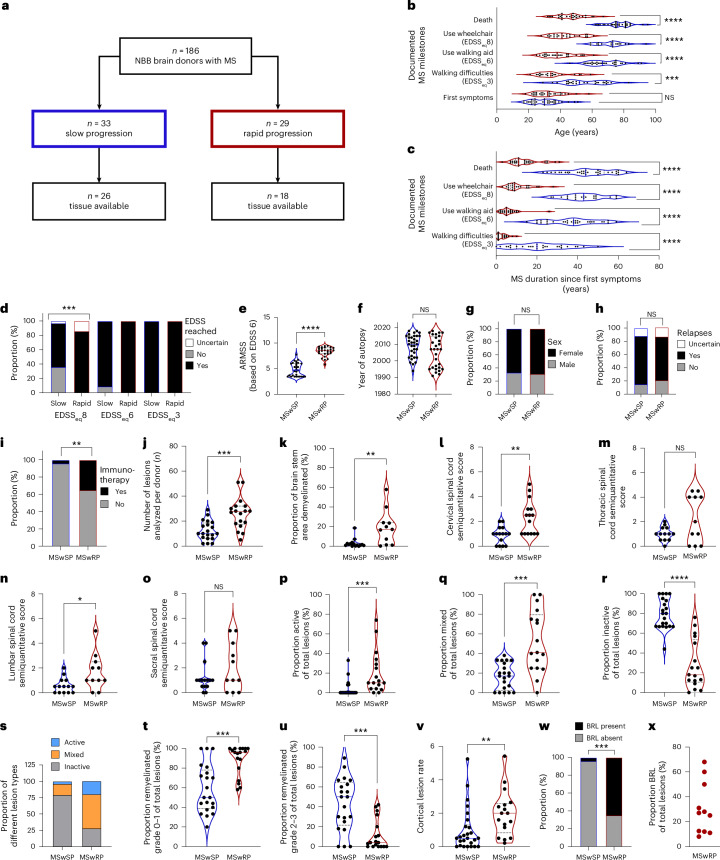
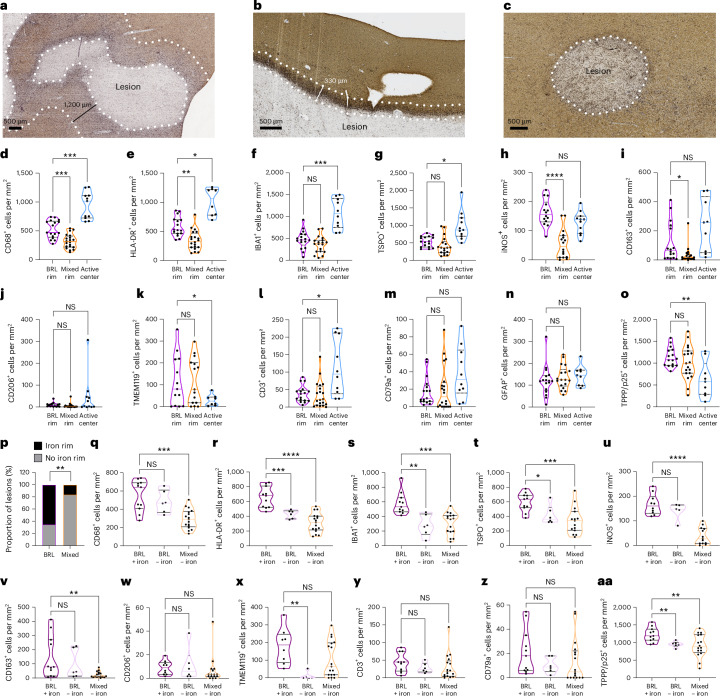
Current multiple sclerosis (MS) treatments reduce relapse activity but have limited impact on disease progression. Clinical trials targeting progression often fail because of insufficient understanding of its underlying mechanisms. This study analyzed a clinically well-characterized MS autopsy cohort from the Netherland Brain Bank (186 individuals) from which we selected donors exhibiting opposite disease trajectories of slow versus rapid progression. We performed extensive unbiased histology and spatial transcriptomics, which unveiled a distinct MS lesion type marked by an extensive myeloid cell rim with cellular and transcriptional signatures of innate immune activation, inflammatory cytokine production, unfolded protein response and apoptosis. Presence of this particular lesion type was linked to rapid disease progression. An independent translocator protein 18-kDa positron emission tomography study (114 individuals) validates the association between lesions with a broad myeloid cell rim and disease progression in individuals with MS. Our findings offer crucial insights into the mechanisms behind MS progression, identifying broad rim lesions as a biomarker for rapid disease progression and potentially guiding patient selection for future therapeutic trials targeting central nervous system intrinsic inflammation.


Conflict of interest statement

Competing interests: L.K. receives research support from the DFG, the Interdisciplinary Center for Clinical Research (IZKF) Münster, the National MS Society, Biogen, Novartis and Merck Serono. She received compensation for serving on scientific advisory boards and speaker honoraria from Alexion, Amgen, Argenx, Bayer, Biogen, Bristol Myers Squibb, Grifols, Hexal, Horizon, Janssen, Merck Serono, Novartis, Roche, Sandoz, Sanofi, Santhera, Teva and Viatris. J.S. receives research support from Roche, Siemens Healthineers, Hansa Biopharma, Stichting MS research, Stichting klimmen tegen MS (MOVES inspiration grant), Nationaal MS fonds and the Erasmus Foundation, and received speaker honoraria or consultancy fees from Biogen, Merck, Novartis, Roche and Sanofi. He serves on the steering committee of the International Progressive MS Alliance, the scientific advisory board of Stichting MS research and several committees of the Dutch Society for Neurology. J.L. received speaker honoraria from Merck and Sanofi. H.W. receives research support from the DFG, the Deutsche Myasthenie Gesellschaft, the European Union, Alexion, Amicus Therapeutics, Argenx, Biogen, CSL Behring, F. Hoffmann-La Roche, Genzyme, Merck KGaA, Novartis, Roche and UCB Biopharma, as well as speaker honoraria or consultancy fees from Alexion, Argenx, Argobio, AOCN, AstraZeneca, BGP Products Operations, Biogen, Bristol Myers Squibb, CEMCAT, Dianthus, EMD Serono, EPG Health/Medthority, Fondazione Cariplo, Genzyme, Idorsia, Immunic, Immunovant, INmune Bio Syneos Health, Kohlhammer, LTS, Lundbeck, Merck, MS at the Limits, Muna Therapeutics, Myrobalan Therapeutics, Neurodiem, NMSS, Novartis, Ology, PSL Group, Red Nucleus, Roche, Samsung, Sangamo, Sanofi, Springer, StreamedUp, the Swiss MS Society, Teladochealth, Toleranzia, Teva, UCB, Uvet, Viatris and WebMD global. He is a member of the scientific advisory boards of Alexion, Argenx, Biocryst, Bristol Myers Squibb, Cellerys, Galapagos, Janssen, Merck, Novartis, Sandoz-Hexal and uniQure biopharma. L.A. receives grants from the Research Council of Finland, the Aatos Erkko Foundation, the US National MS Society, Merck Serono and Sanofi. She has received speaker and advisory honoraria from Sanofi, Biogen, Novartis, Kiniksa, Continuum Therapeutics and Merck. I.H. has received compensation for serving on the scientific advisory board of Muna Therapeutics and serves on a speakers’ panel for Novartis. T.K. receives research funding from the DFG, IZKF Münster, the National MS Society, the German MS Society and Novartis. She has received compensation for serving on the scientific advisory boards of Novartis, Sanofi and Merck, and speaker honoraria from Novartis, Biogen, Sanofi and Roche. The other authors declare no competing interests.

Figures

Fig. 1
Fig. 1. Schematic illustration of the study design.
Left, the brain donor cohort from the NBB included 186 donors. We selected 44 patients with two extreme phenotypes, 26 patients with a very slow disease progression (MSwSP) and 18 patients with a very rapid disease progression (MSwRP), to perform comprehensive histological analyses of a total of 705 MS lesions. BRLs were further characterized using in-depth histological and spatial transcriptomics. Right, the TSPO PET imaging cohort included n = 114 patients with MS with 1,326 lesions in total. Among the 114 patients, 39 patients displayed radiological BRLs (rBRLs). Presence of rBRL was correlated with additional imaging findings and disease progression. ROI, region of interest. DEG, differentially expressed gene. GSEA, gene set enrichment analysis.
Fig. 2
Fig. 2. Patients in the MSwRP group have similar EDSS scores at death compared to patients in the MSwSP group but display more severe histopathological characteristics.
a, Stratification of the patient cohort. b,c, Individuals in the MSwRP group reached equivalents of clinical milestones at an earlier age (b) and after a shorter disease duration (c) compared to individuals in the MSwSP group. In the violin plots, P values were determined using Welch’s analysis of variance (ANOVA), Bonferroni-corrected for multiple testing. d, A higher proportion of individuals in the MSwRP group reached an EDSS of 8 compared to individuals in the MSwSP group; P values were determined using a Fisher’s exact test. e, Individuals in the MSwRP group reached significantly higher scores using ARMSS; the two-tailed P value was determined using a Mann–Whitney U-test. fh, There was no difference between the MSwSP and MSwRP groups regarding the year of autopsy (f), the sex ratio (g) and the proportion of patients with relapses (h). f, Two-tailed P values were determined using a Mann–Whitney U-test. g,h, P values were determined using a Fisher’s exact test. i, A higher proportion of patients with rapid disease progression received immunotherapy; P values were determined using a Fisher’s exact test. jv, The MSwRP group had a higher number of lesions (j), a higher proportion of demyelinated brain stem area (k), a higher cervical lesion load (l), no increase in thoracic lesion load (m), a higher lumbar lesion load (n), no increase in sacral lesion load (o), a higher proportion of active (p,s) and mixed (q,s) lesions, a lower proportion of inactive lesions (r,s), a higher proportion of lesions with limited remyelination (t), a lower proportion of lesions with marked remyelination (u) and a higher cortical lesion rate (v). In the violin plots, two-tailed P values were determined using a Mann–Whitney U-test. w, Individuals in the MSwRP group had a significantly higher proportion of BRLs; the P value was determined using a Fisher’s exact test. x, BRLs consisted of 8–68% of total lesions in the MSwRP group. *P ≤ 0.05; **P ≤ 0.01; ***P ≤ 0.001; ****P < 0.0001; NS, not significant. Source data
Fig. 3
Fig. 3. Histopathological characteristics of BRLs in mixed and active lesions.
ac, BRLs (a), classical mixed lesions (b) and active lesions (c) stained for proteolipid protein (PLP) (brown) and HLA-DR (black). The dashed lines indicate the areas that were analyzed for subsequent quantifications. dk, Comparison of densities of CD68+ (d), HLA-DR+ (e), IBA1+ (f), TSPO+ (g), iNOS+ (h), CD163+ (i), CD206+ (j) and TMEM119+ (k) cells in the rims of BRLs and of mixed and active lesion centers. lo, Densities of CD3+ T cells (l), CD79a+ B cells (m), GFAP+ astrocytes (n) and TPPP/p25+ oligodendrocytes (o). p, BRLs had a higher proportion of iron rims compared to classical mixed lesions. qaa, Comparison of myeloid cell features, lymphocyte infiltration and oligodendrocyte numbers in BRLs with and without iron rims and in mixed lesions without iron. CD68+ (q), HLA-DR+ (r), IBA1+ (s), TSPO+ (t), iNOS+ (u), CD163+ (v), CD206+ (w) and TMEM119+ (x) cells, and CD3+ T cells (y), CD79a+ B cells (z) and TPPP/p25+ oligodendrocytes (aa). do,q,aa, In the violin plots, P values were determined, depending on normality, using a Brown–Forsythe or a one-way Welch’s ANOVA and Dunnett’s test for multiple comparisons (d,f,k,o,ru,aa) or Kruskal–Wallis test (one-way ANOVA) and Dunn’s multiple comparison test (e,gj,ln,q,vz). p, The P value was determined using a Fisher’s exact test. *P ≤ 0.05; **P ≤ 0.01; ***P ≤ 0.001; ****P < 0.0001. Source data
Fig. 4
Fig. 4. Spatial transcriptomic analysis of CD68+ myeloid cells in BRL lesion rims, mixed-lesion rims and active lesion centers compared to NAWM.
a, PCA of the normalized expression data for the three lesion types (active center, BRL rim, mixed rim). b, Venn diagram of DEGs (each lesion type compared to the respective NAWM) of all three lesion types. c, Volcano plot of DEGs (BRL rim over NAWM) that are exclusively upregulated in BRLs but not in other lesion types. The blue dots indicate genes with significant differential enrichment between conditions (Padj < 0.05). Relevant genes of interest are annotated. All comparisons used moderated two-sided t-statistics with Benjamini–Hochberg adjustments for multiple comparisons; non-exclusive, overlapping DEGs were removed. d, GSEA based on DEGs (lesional CD68+ cells over corresponding NAWM) that are shared between all three lesion types, with GO Biological Processes (BP) gene sets as signatures; clusterProfiler’s implementation of a one-sided Fisher’s exact test was used for the enrichment analysis, with Benjamini–Hochberg correction for multiple comparisons. Only significantly enriched terms of biological interest were selected for dot plot visualization. The full set of significant GO terms is displayed in Supplementary Table 5. The colors indicate Padj values; the dot size depicts the geneRatio (the percentage of genes with core enrichment relative to the size of the full gene set). e, GSEA based on DEGs (lesional CD68+ cells over corresponding NAWM) uniquely overexpressed in BRLs, with GO BP gene sets as signatures; clusterProfiler’s implementation of a one-sided Fisher’s exact test was used for the enrichment analysis, with Benjamini–Hochberg correction for multiple comparisons. Only significantly enriched terms of biological interest were selected for dot plot visualization; the full set of significant GO terms is displayed in our Supplementary Table 5. The colors indicate Padj values; the dot size depicts the geneRatio. f,g, GSEA plots based on the GSEA GO term analysis depicted in d,e, respectively; the relevant gene sets were grouped according to relevant functions and genes with core enrichment were combined to form the representative signatures. All P values were calculated with the clusterProfiler GSEA permutation test and adjusted for multiple hypothesis testing with the Benjamini–Hochberg method. MHC, major histocompatibility complex. Source data
Fig. 5
Fig. 5. Detection of rBRLs using TSPO PET.
a, Detection of rBRLs versus non-BRLs using TSPO PET. Examples of rBRL, non-rBRL rim-active and inactive lesions are shown (labeled as HH, HL and LL, respectively). The color bar shows the dynamic range of DVR in the images. b, Patients with no, one or more than one rBRL. c, Violin plot of the proportion of rBRLs in patients with at least one rBRL. d, Total lesion numbers were higher in patients with at least one rBRL (P = 1.1 × 10−6; Mann–Whitney U-test). e,f, Proportion of rBRLs correlated with the proportion of TSPO PET rim-active lesions (e) (P = 0.0005) and inversely with the proportion of TSPO PET inactive lesions (f) (P = 1.1 × 10−8) (Spearman correlation). gi, Proportions of rBRL correlated with T1 (g) (P = 4.5 × 10−7) and T2 (h) lesion loads (P = 4.9 × 10−8) in MRI and with NAWM DVR (i) (P = 4.5 × 10−7) in TSPO PET (Spearman correlation). jm, FA in NAWM (j,k) correlated negatively and MD in NAWM (l) correlated positively with rBRL proportions (Spearman correlation); rBRL patients had lower FA (k) P = 0.006) and higher MD values (m) (P = 0.039) in NAWM (Welch’s t-test). n, Patients (n = 41) with at least one rBRL had slightly higher numbers of QSM+ rim lesions (P = 0.087; Mann–Whitney U-test). o, Violin plot of age at disease onset in patients with and without rBRLs. An unpaired t-test was used. p,q, Proportions of patients treated with DMTs (Fisher’s exact test) (p) and annual relapse rate (q) in patients with and without rBRLs (Mann–Whitney U-test). r, Proportion of SPMS in patients with and without rBRL (P = 0.075; Fisher’s exact test). s, Disease duration in patients with and without rBRL (P = 0.044; Mann–Whitney U-test). t,u, EDSS milestones (EDSS 4 or 6 within 12 years) in patients with rBRL, non-rBRL rim-active lesion or neither (t, P = 0.028; u, P = 0.006). A Fisher’s exact test was used. v, Higher EDSS in patients with rBRL (P = 0.005; Dunn’s test) but not non-rBRL rim-active lesions compared to those without these lesion types (Kruskal–Wallis test, P = 0.006). w,x, Changes in rBRL numbers in natalizumab-treated (w) (n = 9) and untreated (x) MS patients (n = 9). y, Natalizumab and untreated cohorts in w,x had a significant difference in the change in rBRL numbers (P = 0.021; Mann–Whitney U-test). All tests used in this figure are two-tailed. *P ≤ 0.05; **P ≤ 0.01; ****P < 0.0001. Source data
Extended Data Fig. 1
Extended Data Fig. 1. Histological characteristics of broad rim lesions (BRL).
Large demyelinated lesion with a sharp border (immunohistochemistry for MBP). b, the lesion is surrounded by a broad rim of HLA-DR positive myeloid cells. c, quantification of myeloid rim size in a subset of MSwRP and MSwSP. d to g, Immunohistochemistry for CD68+ (d), HLA-DR+ (e), IBA1+ (f) myeloid cells as well as TSPO+ myeloid cells and astrocytes (g). h to m, Depiction of iNOS+ (h) and TMEM119+ cells (i), CD3 + T cells (j), CD79a positive B cells (k), GFAP+ astrocytes (l) and TPPP/p25+ oligodendrocytes (m). Scale bars in a and b: 2.5 mm, scale bars in d to g 100 µm, scale bars in h to m 50 µm.
Extended Data Fig. 2
Extended Data Fig. 2. Broad rim lesions (BRL) with and without iron rims.
The left panel displays a BRL lesion without an iron rim, whereas the right panel displays a BRL lesion with an iron rim. a and b, Two broad rim lesions stained for HLA-DR. c and d, Inserts in a and b are shown in higher magnification in c and d. e and f, Turnbull staining reveals a high number of iron containing myeloid cells at the border of the lesion in f, but not in e. Scale bars in a 2,5 mm, in b 5 mm, and in c to f 250 µm.
Extended Data Fig. 3
Extended Data Fig. 3. Comparison of the histopathological characteristics of MS patients with rapid disease progression (MSwRP) with and without BRL.
a to c, MSwRP with and without BRL had comparable proportions of active and inactive lesions. c, only a small subset of lesions in MSwRP display signs of marked remyelination independent of the presence or absence of BRL; d, No difference in the cortical lesion rate between MSwRP with and without BRL; a to d: violin plots, two-tailed p-values were determined by Mann-Whitney test. Source data
Extended Data Fig. 4
Extended Data Fig. 4. Comparison of BRL and mixed lesions.
a to a, Comparison of densities of CD68+ (a), HLA-DR+ (b), IBA1+ (c), TSPO+ (d), iNOS+ (e) 163+ (f) CD206+ (g) and TMEM119+ (h) cells in NAWM, rims and lesion centers of BRL and mixed lesions. i to k, No differences in the densities of CD79a+ B cells (i), CD3+ T cells (j), GFAP+ astrocytes (k) and TPPP/p25+oligodendrocytes (l) in the rims of BRL. m to w, Stratification of BRL and mixed lesions with respect to the presence or absence of iron depositions in the rims of these lesions. Densities of CD68+ (m), HLADR+ (n), IBA1+ (o), TSPO+ (p), iNOS+ (q), CD163+ (r), CD206+ (s), TMEM119+ (t), CD3+ (u), CD79a+ (v) and TPPP/p25+ (w) cells a to w: violin plots, p values were determined depending on normality by Kruskal-Wallis (one-way ANOVA) and Dunn’s multiple comparison test (a, c to j, i,r to v) or Brown-Forsythe and Welch ANOVA test (one-way ANOVA) and Dunnett’s correction for multiple comparisons (b,c, k, m to o and w). * p ≤ 0.05, ** p ≤ 0.01, *** p ≤ 0.001, **** p ≤ 0.0001. Source data
Extended Data Fig. 5
Extended Data Fig. 5. Histological comparison and disease severity and genotype-phenotype correlations within the entire NBB-MS cohort with and without broad rim lesions (BRL).
a to c, Patients with at least one BRL reached EDSS 6 and 8 faster and died after a shorter disease duration compared to patients without BRL, demonstrating that the presence of BRL is associated with a more severe disease course. d, Patients with at least 1 BRL have a higher age-adjusted multiple sclerosis severity score (ARMSS). Two-tailed pvalues in a to d were determined by Mann-Whitney test. e, Genotype distribution of MS severity associated SNP rs10191329 in MS donors of the NBB with at least 1 BRL or without BRL. The Y-axis displays the relative number of donors carrying the respective genotype and the number in the bar graph represents the absolute number of donors. A significant difference in distribution of genotypes was found between the two groups using Fisher’s exact test (p = 0.015). f, Same as e, but for MS susceptibility SNP rs3135388. No significant difference could be detected in the genotype distribution between the two groups (p = 0.60). * p ≤ 0.05, ** p ≤ 0.01, *** p ≤ 0.001, **** p ≤ 0.0001. Source data
Extended Data Fig. 6
Extended Data Fig. 6. Spatial transcriptomic analysis of CD68 pos myeloid cells in BRL lesion rims, mixed lesion rims and active lesion centers as compared to normal appearing white matter (NAWM).
a, Example of a BRL lesions stained for CD68 (yellow) and the oligodendroglial marker TPPP/p25 (red) and nuclear staining (SYTO83, blue) in the left panel. In the right panel, demonstration of selection masks (green, arrows) used to identify CD68+ myeloid cells for spatial transcriptomic analysis. b, VENN diagram of GO terms (each lesion type compared to respective NAWM) of all three lesion types. c, Spearman correlation of DEG between all lesion types and NAWM. d, Volcano plots of DEGs in BRL CD68+ myeloid cells versus mixed lesion CD68+ myeloid cells (upper panel) as well as of DEG in BRL CD68+ cells versus active lesion CD68+ myeloid cells (lower panel), and respective NAWM. Blue dots indicate genes with significant differential enrichment between conditions (adjusted p value < 0.05); relevant genes of interest are annotated. e, Heatmap visualization of gene set enrichment analysis (GSEA) of the three lesion types with published transcriptomic signatures, with Gene Ontology (GO) Biological Processes (BP) gene sets as signatures. Only signatures with significance in comparison to at least one lesion type are depicted. f, Expression of three genes of interest in all three lesion types and in NAWM, depicted are Bruton tyrosine kinase (BTK), CD40L, and RIPK1. Source data
Extended Data Fig. 7
Extended Data Fig. 7. Correlation between imaging findings and histopathology.
An autopsy case: a male subject with progressive MS, aged 44.5 years with a disease duration of 15 years at death. a, FLAIR image 7.5 years before death showing large lesions. b, T1 image 6 years before death overlaid with PET showing high PK11195 signal at the edge of the lesions. c, FLAIR image 2 years before death showing further enlargement of the lesions with prominent atrophy. The arrows and their colors refer to d and g. d and g, Gross anatomy. The boxed areas were analyzed by histology. e and f, The lesion area indicated by the orange rectangle in d stained for the myelin marker MBP (e) and the myeloid cell marker HLA-DR (f). h and I, The lesion area indicated by the blue rectangle in g stained for MBP (h) and HLA-DR (i). Dashed lines in e,f, and h,i indicate the lesion border or the rim border, respectively. Scale bar for e,f,h,i: 3 mm.
Extended Data Fig. 8
Extended Data Fig. 8. Imaging findings.
a Examples of T1 and QSM images. Arrows indicate T1 lesions (upper row) and the corresponding sites after QSM analyses (lower row). b-f, There was no difference in lesion volumes, 2–4 mm T1 lesion rim FA values, or core and rim susceptibility values between the individual rBRL lesions and non-rBRL rim-active lesions, but rBRL had significantly lower 2–4 mm T1 lesion rim MD values (Mann-Whitney U-test). g, There was no difference in the presence of iron rims found in individual rBRL and non-rBRL rim-active lesions (Fisher’s exact test). h, Patients with non-rBRL rim-active lesions and progression data from PET imaging onwards available (n = 72): no difference was found in the number of non-rBRL rim-active lesions (Mann-Whitney U-test). i, Patients with rBRL and progression data from PET imaging onwards available (n = 36): there was a trend towards the progressed patients having more rBRL (p = 0.066; Mann-Whitney U-test). Mean follow-up time from PET imaging to follow-up EDSS measurement was 5.5 years (SD 2.3). j-k, Proportion of non-rBRL rim-active lesions (j) and rBRL (k) in an untreated MS cohort (n = 18) followed up clinically for an average of 6.5 (SD 2.4) years from PET imaging (n = 11 with progression, n = 7 remaining stable). l, In reference to Fig. 5x–y, this table shows the baseline lesion phenotype status of the rBRLs detected at follow-up PET imaging at one year time point for the untreated cohort (n = 9). Source data

References

    1. Stampanoni Bassi, M., Iezzi, E. & Centonze, D. Multiple sclerosis: inflammation, autoimmunity and plasticity. Handb. Clin. Neurol.184, 457–470 (2022). - PubMed
    1. Lublin, F. D. et al. Defining the clinical course of multiple sclerosis: the 2013 revisions. Neurology83, 278–286 (2014). - PMC - PubMed
    1. Tur, C. et al. Association of early progression independent of relapse activity with long-term disability after a first demyelinating event in multiple sclerosis. JAMA Neurol.80, 151–160 (2023). - PMC - PubMed
    1. Kappos, L. et al. Contribution of relapse-independent progression vs relapse-associated worsening to overall confirmed disability accumulation in typical relapsing multiple sclerosis in a pooled analysis of 2 randomized clinical trials. JAMA Neurol.77, 1132–1140 (2020). - PMC - PubMed
    1. Cree, B. A. C. et al. Silent progression in disease activity-free relapsing multiple sclerosis. Ann. Neurol.85, 653–666 (2019). - PMC - PubMed

LinkOut - more resources