. 2025 May;31(5):1494-1501.
doi: 10.1038/s41591-025-03678-8. Epub 2025 Apr 29.

Personalized inhaled bacteriophage therapy for treatment of multidrug-resistant Pseudomonas aeruginosa in cystic fibrosis

Affiliations

Personalized inhaled bacteriophage therapy for treatment of multidrug-resistant Pseudomonas aeruginosa in cystic fibrosis

Benjamin K Chan et al. Nat Med. 2025 May.

Abstract

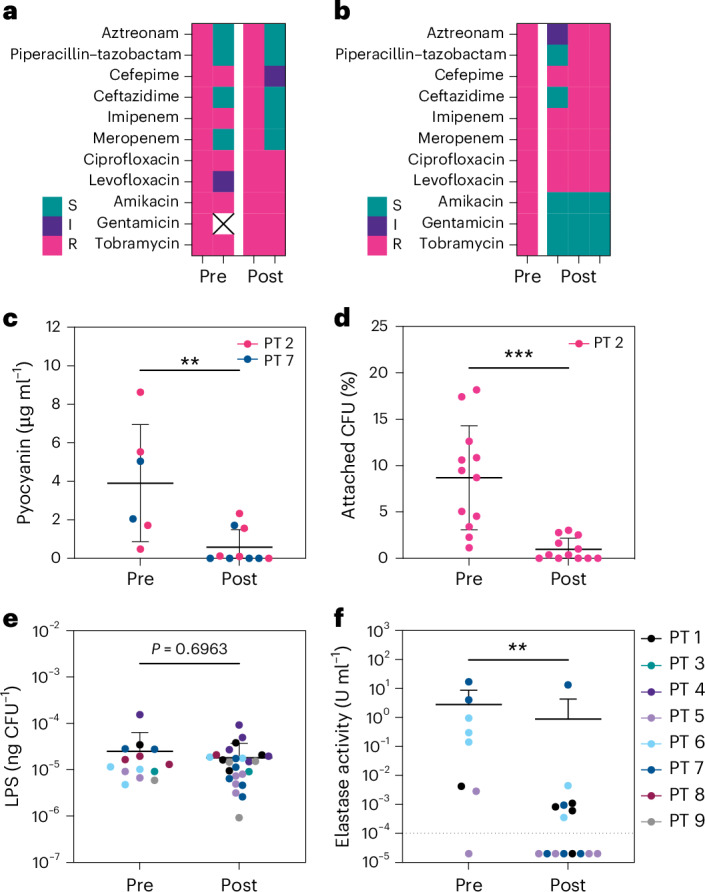
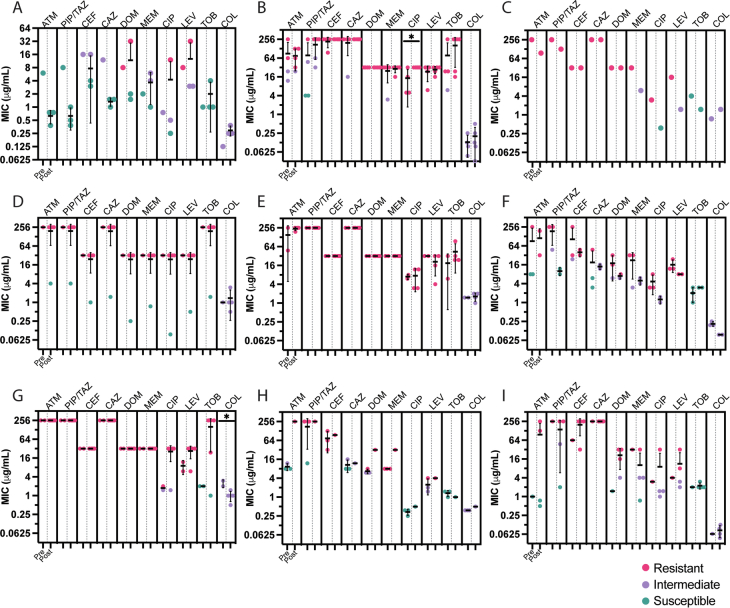
Bacteriophage (phage) therapy, which uses lytic viruses as antimicrobials, is a potential strategy to address the antimicrobial resistance crisis. Cystic fibrosis, a disease complicated by recurrent Pseudomonas aeruginosa pulmonary infections, is an example of the clinical impact of antimicrobial resistance. Here, using a personalized phage therapy strategy that selects phages for a predicted evolutionary trade-off, nine adults with cystic fibrosis (eight women and one man) of median age 32 (range 22-46) years were treated with phages on a compassionate basis because their clinical course was complicated by multidrug-resistant or pan-drug-resistant Pseudomonas that was refractory to prior courses of standard antibiotics. The individuals received a nebulized cocktail or single-phage therapy without adverse events. Five to 18 days after phage therapy, sputum Pseudomonas decreased by a median of 104 CFU ml-1, or a mean difference of 102 CFU ml-1 (P = 0.006, two-way analysis of variance with Dunnett's multiple-comparisons test), without altering sputum microbiome, and an analysis of sputum Pseudomonas showed evidence of trade-offs that decreased antibiotic resistance or bacterial virulence. In addition, an improvement of 6% (median) and 8% (mean) predicted FEV1 was observed 21-35 days after phage therapy (P = 0.004, Wilcoxon signed-rank t-test), which may reflect the combined effects of decreased bacterial sputum density and phage-driven trade-offs. These results show that a personalized, nebulized phage therapy trade-off strategy may affect clinical and microbiologic endpoints, which must be evaluated in larger clinical trials.


Conflict of interest statement

Competing interests: The following authors declare no competing interests: G.L.S., A.C.V., M.M., I.M.O., Y.S., S.W., C.N.G., B.I.K., G.R., Z.M.H., C.J.B., J.S., J.S.T., C.R.A., N.C., S.K.J., R.J., A.K., B.S.Q., J.M.R., C.C.T., Q.-A.M., V.S. and J.L.K. The following authors declare a competing interest: B.K.C., K.E.K. and P.E.T. for US Provisional Patent Application No. 62/844,515, filed 7 May 2019, and US Provisional Patent Application No. 63/017,369, filed 29 April 2020, for bacteriophages (OMKO1, LPS-5 and TIVP-H6) that have been studied in this project.

Figures

Fig. 1
Fig. 1. Effect of phage therapy on bacterial burden and lung function.
a, Sputum analysis was performed before and after phage therapy. PsA CFU ml−1 from each patient’s sputum (n = 9) were counted in replicates of three and averaged. CFU ml−1 was measured before therapy (Pre) and at two time points after therapy (Post (14 days), 5–18 days (average 8.4, median 7), and Post (30 days), 15–42 days (average 22.7, median 20)); **P = 0.006 and *P = 0.0112; two-way ANOVA with Dunnett’s multiple-comparisons test. Two participants did not provide sputum samples after Post (14 days). b, Spirometry was performed before and after (days 21–35) phage therapy and reported as ppFEV1% best single measurement from at least three tests per the American Thoracic Society standards of acceptability and repeatability; **P = 0.004; Wilcoxon signed-rank two-tailed t-test. PT, patient.
Fig. 2
Fig. 2. Effect of phage therapy PsA antibiotic susceptibility and virulence.
a,b, Antibiotic susceptibility results from clinical microbiology laboratory testing for sputum isolates taken before and after therapy from patient 1 (a) and patient 3 (b) are shown (R, resistant; S, susceptible; I, intermediate; X, not reported). c, Production of pyocyanin (µg ml−1) was measured from PsA isolates before therapy (N = 6) and after (N = 10) therapy from patients who received TIVP-H6 phage therapy (**P = 0.0047; Mann–Whitney test). d, Attachment of PsA to CF airway epithelial cells before (N = 6) and after (N = 6) therapy in duplicate from patient 2 (***P = 0.0005; Mann–Whitney test). e, LPS (ng CFU−1) quantification from PsA sputum isolates taken before therapy (N = 14) and after therapy (N = 25) from patients who received phage therapy with LPS-5 (P = 0.6963; Mann–Whitney test). f, Secreted elastase activity (U ml−1) from PsA sputum isolates taken before therapy (N = 8) and after therapy (N = 15) from patients who received phage therapy with LPS-5 (**P = 0.002; Mann–Whitney test). Data presented as mean values ± s.d.
Fig. 3
Fig. 3. Nonsynonymous variants in post-treatment isolate genomes.
ac, Circular plots showing the distribution of variants in the post-treatment PsA isolate genomes of patient 1 (a), patient 4 (b) and patient 7 (c). Concentric circles represent single isolate genomes. Gray lines represent nonconservative variants that appear in coding sequences in one or more post-treatment isolates but are absent from all pre-treatment isolates. Orange lines represent nonconservative variants (nonsynonymous polymorphisms and frameshifts) coincident with genes expected to be under selection by the phage used in treatment. Labeled, colored arrows indicate the positions and functional categories of these genes. Vertical black lines represent the genome start in the PAO1 reference against which variants were called.
Extended Data Fig. 1
Extended Data Fig. 1. PsA Antibiotic Sensitivity and Susceptibility.
MIC and antibiotic susceptibility results from sputum isolates taken pre- and post-therapy for (A) patient 1 (Npre=1, Npost=3, p = NA), (B) patient 2 (Npre=4, Npost=5, p=0.6905, 0.2063, 0.4444, 0.4444, >0.9999, 0.7222, 0.0476, 0.7619, 0.3968, 0.7857), (C) patient 3 (Npre=1, Npost=1, p=NA), (D) patient 4 (Npre=1, Npost=4, p=NA), (E) patient 5(Npre=2, Npost=4, p = 0.733, >0.9999, >0.9999, >0.9999,> 0.9999, >0.9999, >0.9999, 0.4667, 0.6667, 0.8667), (F) patient 6 (Npre=3, Npost=2, p=0.6000, 0.2000, 0.9000, 0.8000, 0.5000, 0.6000, 0.1000, 0.1000, 0.4000, 0.1000), (G) patient 7 (Npre=2, Npost=5, p=>0.9999, >0.9999, >0.9999, >0.9999, >0.9999, >0.9999, 0.1429, 0.1429, 0.3333, 0.0476), (H) patient 8 (Npre=3, Npost=1, p=NA), and (I) patient 9 (Npre=1, Npost=4, p=NA), to aztreonam (ATM), piperacillin/tazobactam (PIP/TAZ), cefepime (CEF), ceftazidime (CAZ), doripenem (DOM), meropenem (MEM), ciprofloxacin (CIP), levofloxacin (LEV), tobramycin (TOB) and colistin (COL). Antibiotic susceptibility determined to be resistant, intermediate, or sensitive according to CLSI. Data presented as mean +/- SD (Mann-Whitney test).
Extended Data Fig. 2
Extended Data Fig. 2. Effect of TIVP-H6 Phage Therapy on Pyocyanin Production.
Production of pyocyanin (µg/mL) from cultures of bacterial isolates taken pre-and post-therapy from (A) patient 1 (Npre=1, Npost=3, p=NA), (B) patient 2 (Npre =4, Npost =5, p=0.1759), (C) patient 3 (Npre =1, Npost =1, p=NA), (D) patient 4 (Npre =1, Npost =6, p=NA), (E) patient 5 (Npre =2, Npost =4, p > 0.9999), (F) patient 6 (Npre =3, Npost =3, p > 0.9999), (G) patient 7 (Npre =2, Npost =5, p=0.0476), (H) patient 8 (Npre =3, Npost =1, p=NA), and (I) patient 9 (Npre =1, Npost =3, p=NA). Data representative of two independent experiments; error bars represent median (Mann-Whitney test).
Extended Data Fig. 3
Extended Data Fig. 3. Effect of LPS-5 Phage Therapy on LPS content.
Quantification of extracted LPS (ng/CFU) from PsA sputum isolates taken pre- and post-therapy from (A) patient 1 (Npre =1, Npost =3, p=NA), (B) patient 2 (Npre =4, Npost =5, p=0.2857), (C) patient 3 (Npre =1, Npost =1, p=NA), (D) patient 4 (Npre =1, Npost =5, p=NA), (E) patient 5 (Npre =2, Npost =4, p=0.5333), (F) patient 6 (Npre =3, Npost =3, p=0.0403), (G) patient 7 (Npre =2, Npost =5, p=0.0952), (H) patient 8 (Npre =3, Npost =1, p=NA), and (I) patient 9 (Npre =1, Npost =3, p=NA). Data representative of two independent experiments; error bars represent median (Welch’s t test or Mann-Whitney test).
Extended Data Fig. 4
Extended Data Fig. 4. Effect of LPS-5 Phage Therapy on PsA Elastase Production.
Secreted elastase activity (U/mL) from PsA sputum isolates taken pre- and post-therapy from (A) patient 1 (Npre =1, Npost =3, p=NA), (B) patient 2 (Npre =4, Npost =5, p=0.2857), (C) patient 3 (Npre =1, Npost =1, p=NA), (D) patient 4 (Npre =1, Npost =6, p=NA), (E) patient 5 (Npre =2, Npost =4, p=0.3333), (F) patient 6 (Npre =3, Npost =3, p=0.2032), (G) patient 7 (Npre =2, Npost =5, p=0.2381), (H) patient 8 (Npre =3, Npost =1, p=NA), and (I) patient 9 (Npre =1, Npost =3, p=NA). Data representative of two independent experiments; error bars represent median (Mann-Whitney test).
Extended Data Fig. 5
Extended Data Fig. 5. Effect of Phage Therapy on Sputum Microbiome.
(A) Relative abundance of bacteria genera (greater than 0.1%) in sputum samples over time: pre-therapy (pre), during therapy (d0), and post-therapy (d7-14, d14+). Analysis of alpha diversity via (B) Chao-1 richness, (C) Shannon Evenness, and (D) Simpson [not significant (ns); ANOVA with Tukey Correction for multiple comparisons]. Box and whisker plots presented as min, max, 25% and 75% quartile and median.
Extended Data Fig. 6
Extended Data Fig. 6. Nonsynonymous Variants in Post-Treatment Isolate Genomes.
Circular plots showing the distribution of variants in the post-treatment isolate genomes for the patients not shown in Fig. 3. Concentric circles represent single isolate genomes. Gray lines represent nonconservative variants that appear in coding sequences in one or more post-treatment isolates but are absent from all pre-treatment isolates. Yellow lines represent nonsynonymous polymorphisms coincident with genes expected to be under selection by the phage used in treatment. Red lines represent frameshifts for the same genes. Labeled, colored arrows indicate the positions and functional categories of these genes. Vertical black lines represent the genome start in the PAO1 reference against which variants were called.

References

    1. O’Neill, J. in Review on Antimicrobial Resistance 1–14 (HM Government & Wellcome Trust, 2014).
    1. De Oliveira, D. M. P. et al. Antimicrobial resistance in ESKAPE pathogens. Clin. Microbiol. Rev.33, e00181-19 (2020). - PMC - PubMed
    1. Durda-Masny, M. et al. The determinants of survival among adults with cystic fibrosis—a cohort study. J. Physiol. Anthropol.40, 19 (2021). - PMC - PubMed
    1. Kortright, K. E., Chan, B. K., Koff, J. L. & Turner, P. E. Phage therapy: a renewed approach to combat antibiotic-resistant bacteria. Cell Host Microbe25, 219–232 (2019). - PubMed
    1. Pirnay, J. P. et al. Personalized bacteriophage therapy outcomes for 100 consecutive cases: a multicentre, multinational, retrospective observational study. Nat. Microbiol.9, 1434–1453 (2024). - PMC - PubMed

MeSH terms

Substances