. 2025 Apr 29;8(1):675.
doi: 10.1038/s42003-025-08083-y.

A secretome atlas of cardiac fibroblasts from healthy and infarcted mouse hearts

Affiliations

A secretome atlas of cardiac fibroblasts from healthy and infarcted mouse hearts

Jasmin Bahr et al. Commun Biol. .

Abstract

Cardiac fibroblasts (CF) are key players after myocardial infarction (MI), but their signaling is only incompletely understood. Here we report a first secretome atlas of CF in control (cCF) and post-MI mouse hearts (miCF), combining a rapid cell isolation technique with SILAC and click chemistry. In CF, numerous paracrine factors involved in immune homeostasis are identified. Comparing secretome, transcriptome (SLAMseq), and cellular proteome disclose protein turnover. In miCF at day 5 post-MI, significantly upregulated proteins include SLIT2, FN1, and CRLF1 in mouse and human samples. Comparing the miCF secretome at days 3 and 5 post-MI reveals the dynamic nature of protein secretion. Specific in-vivo labeling of miCF proteins via biotin ligase TurboID using the POSTN promotor mirrors the in-vitro data. In summary, we identify numerous paracrine factors specifically secreted from CF in mice and humans. This secretome atlas may lead to new biomarkers and/or therapeutic targets for the activated CF.


Conflict of interest statement

Competing interests: The authors declare no competing interests.

Figures

Fig. 1
Fig. 1. Workflow of comparative secretome analysis of CF from sham control hearts (cCF) and infarcted hearts (miCF).
CF were isolated from mouse hearts 5 days after MI (50 min ischemia/reperfusion, I/R; miCF) or sham surgery (sham; cCF) and cultured in conventional cell culture medium containing 10% FBS for 24 h. Amino acids L-methionine (Met), L-arginine (Arg), and L-lysine (Lys) were withdrawn for 1 h and subsequently replaced by azidohomoalanine (AHA) together with either intermediate or heavy Arg and Lys isotypes ([13C6] Arg, [4,4,5,5-D4] Lys or [13C6, 15N4] Arg, [13C6, 15N2] Lys, respectively). After incubation for 8 h, cCF and miCF supernatants were harvested and combined. Newly synthesized, AHA-containing proteins were bound to an agarose-resin by click chemistry. After stringent washing to remove non-bound proteins, remaining proteins were enzymatically digested and eluted peptides were applied to LC-MS/MS. In the following data analysis, intermediate and heavy isotype labels were used to assign peptides to cCF and miCF samples.
Fig. 2
Fig. 2. Secretome analysis in cCF.
LC-MS/MS data identified 122 secreted proteins in cCF isolated from sham control mouse hearts 5 days after surgery (n = 4; source data in Supplementary Data 1). A Protein localization as predicted by OutCyte. Shown is the percentage of released proteins classified as conventionally secreted (Conv), unconventionally secreted (UPS), intracellular (IC), and transmembrane (TM) proteins. B Protein intensity fractions of cCF secretome categorized as ECM-associated proteins and paracrine/autocrine factors according to KEGG annotation and PubMed search. C Subcategories of ECM-associated proteins. D Subcategories of proteins assigned as paracrine/autocrine factors. E Relative intracellular levels (intensities) measured in cell lysates of proteins that were identified in cCF secretome analysis (32 of the 122 secreted proteins). F Protein intensity representation of all proteins secreted from cCF.
Fig. 3
Fig. 3. Comparison of secretome, proteome, and transcriptome in cCF.
Gene expression (transcript levels, light gray bars; source data in Supplementary Data 3), cellular proteome (protein intensities, gray bars; source data in Supplementary Data 2), and secretome (protein intensities, dark gray bars; source data in Supplementary Data 1) of the 122 proteins identified in cCF secretome analysis. Data are shown in a Circos plot as means of n = 3 (transcriptome) and n = 4 (secretome, proteome) of cCF preparations from unstressed hearts. To permit comparison, mean value of the gene/protein with the highest expression in the transcriptome (COL1A1, Col1a1) and secretome (PAI-1, Serpine1) was set to 100%. Due to the dominance of HSP47 (Serpinh1) in the proteome, the second highest value (COL1A1) was set to 100% and HSP47 (=1239%) was cropped to allow visualization of lower-abundant proteins.
Fig. 4
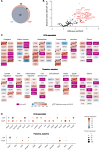
Fig. 4. MI-induced changes of the CF secretome 5 days after infarction.
LC-MS/MS analysis identified 153 secreted proteins from post-MI CF (miCF) isolated from mouse hearts 5 days after I/R surgery (n = 4; source data in Supplementary Data 1). These data were compared to the basal secretome data (122 proteins) of cCF isolated from sham-operated hearts 5 days after surgery (n = 4; source data in Supplementary Data 1). A Venn diagram of identified proteins. B Volcano plot of differentially secreted proteins. Proteins with significantly different intensities in cCF and miCF samples (Student’s t test-based SAM analysis, 5% FDR, S0 = 0.1) are highlighted in red (28 proteins). For statistical significance analysis of secreted proteins which were only detected in miCF, an imputation approach of missing base values was performed, using values taken from a downshifted normal distribution (details in Methods). Names of top 15 proteins with highest difference between cCF and miCF are annotated. The shown difference refers to the difference of group mean values of log2 transformed intensities. C Log2 fold changes (FC) of protein intensities between miCF and cCF samples visualized with Cytoscape. Proteins were grouped in subcategories ECM-associated proteins and paracrine/autocrine factors. D Transcript levels of the 28 significantly changed proteins in the transcriptome of CF of mouse hearts 5 days after I/R (miCF) or sham surgery (cCF) (n = 3 each). Previously published scRNAseq data of cCF and miCF were re-analyzed and expression levels in the total cCF/miCF population are visualized as dot plots.
Fig. 5
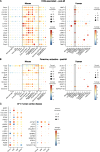
Fig. 5. CF specificity of significantly altered secretome proteins post-MI.
A, B Transcript levels of the 28 significantly changed proteins between the miCF secretome and the cCF secretome in the transcriptome of cell populations of n = 3 infarcted mouse hearts 5 days after I/R (left panels) and of n = 3 human heart specimen of acute MI (AMI, <3 months post-MI) patients (right panels). Previously published scRNAseq data of murine stromal and immune cell populations and snRNAseq data of human cardiac cells were re-analyzed. Expression levels are visualized as dot plots, subdivided in (A) ECM-associated proteins and (B) paracrine and autocrine factors. Values of CF populations are enframed. DC, dendritic cell; EPDC, epicardium-derived cell; SMC, smooth muscle cell. C To compare the expression of the miCF secretome proteins in CF in human MI and heart failure, we used CITE-seq data of human left ventricle (LV) CF obtained from n = 6 healthy donors, n = 4 acute MI (AMI) patients (<3 months post-MI), n = 6 ischemic cardiomyopathy (ICM, >3 months post-MI) patients, and n = 6 nonischemic cardiomyopathy (NICM, idiopathic dilated cardiomyopathy) patients. Details regarding the origin of tissue collected are provided in the method section.
Fig. 6
Fig. 6. MI-induced changes of the CF secretome 3 and 5 days after infarction.
LC-MS/MS analysis identified 129 secreted proteins from post-MI CF (miCF) isolated from mouse hearts 3 days after I/R surgery (n = 4; source data in Supplementary Data 1): These data were compared to the secretome data (153 proteins) of miCF from mouse hearts 5 days after I/R surgery (n = 4; source data in Supplementary Data 1). A Venn diagram of significantly changed secretome proteins of miCF in comparison to the secretome proteins of cCF from sham-operated hearts 3 and 5 days after surgery (n = 4 each, source data in Supplementary Data 1), respectively. B Fold changes of selected secretome proteins between miCF and cCF at days 3 and 5 post I/R and sham surgery, respectively.
Fig. 7
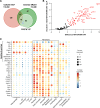
Fig. 7. In-vivo-secretome analysis of POSTN+ CF 5 days post-MI.
Mice were transduced with AAV9-POSTN-ER-TurboID to allow biotin-labeling and subsequent enrichment of proteins secreted from POSTN+ CFs in the coronary effluent (work flow in Supplementary Fig. 8). LC-MS/MS analysis identified 157 proteins in the coronary effluent 5 days after I/R surgery (n = 6; source data in Supplementary Data 4). These data were compared to the secretome data (153 proteins) of miCF isolated from hearts 5 days after MI (n = 4; source data in Supplementary Data 1). A Venn diagram of identified proteins. Green circle, 157 proteins identified in the coronary effluent 5 days post-MI. White circle, 73 proteins significantly enriched in the effluent of AAV9-POSTN-ER-TurboID-transduced mice (n = 6) in comparison to non-transduced control mice 5 days post-MI (n = 6), representing the in-vivo-secretome of POSTN+ CF. Red circle, 153 proteins in the miCF secretome 5 days post-MI. B Volcano plot of proteins identified in the coronary effluent. Proteins with significantly different intensities in samples from TurboID-transduced mice (MI + AAV) and non-transduced control mice (MI-AAV) (Student’s t-test-based SAM analysis, 5% FDR, S0 = 0.6) are highlighted in red (73 proteins). Names of top 15 proteins with highest difference between MI + AAV and MI-AAV are annotated. The shown difference refers to the difference of group mean values of log2 transformed intensities. C Dot plot visualizing transcript levels of the proteins identified in both data sets in the transcriptome of cell populations of n = 3 infarcted mouse hearts 5 days after I/R: proteins that were significantly enriched in the effluent of AAV9-POSTN-ER-TurboID-transduced mice (10 proteins) and proteins that did not reach significance in comparison to non-transduced mice (17 proteins). Previously published scRNAseq data of murine stromal and immune cell populations were re-analyzed.

References

    1. Tuleta, I. & Frangogiannis, N. G. Fibrosis of the diabetic heart: clinical significance, molecular mechanisms, and therapeutic opportunities. Adv. Drug Deliv. Rev.176, 113904 (2021). - PMC - PubMed
    1. Frangogiannis, N. G. Cardiac fibrosis. Cardiovasc. Res. 10.1093/cvr/cvaa324 (2020).
    1. Aoki, T. et al. Prognostic impact of myocardial interstitial fibrosis in non-ischemic heart failure. -comparison between preserved and reduced ejection fraction heart failure. Circ. J. Jpn. Circ. Soc.75, 2605–2613 (2011). - PubMed
    1. Ivey, M. J. & Tallquist, M. D. Defining the cardiac fibroblast. Circ. J. Jpn. Circ. Soc.80, 2269–2276 (2016). - PMC - PubMed
    1. Lindsey, M. L., Jung, M., Hall, M. E. & DeLeon-Pennell, K. Y. Proteomic analysis of the cardiac extracellular matrix: clinical research applications. Expert Rev. Proteom.15, 105–112 (2018). - PMC - PubMed