. 2025 Jun;6(6):1000-1016.
doi: 10.1038/s43018-025-00960-z. Epub 2025 Apr 29.

Whole-exome tumor-agnostic ctDNA analysis enhances minimal residual disease detection and reveals relapse mechanisms in localized colon cancer

Affiliations

Whole-exome tumor-agnostic ctDNA analysis enhances minimal residual disease detection and reveals relapse mechanisms in localized colon cancer

Jorge Martín-Arana et al. Nat Cancer. 2025 Jun.

Abstract

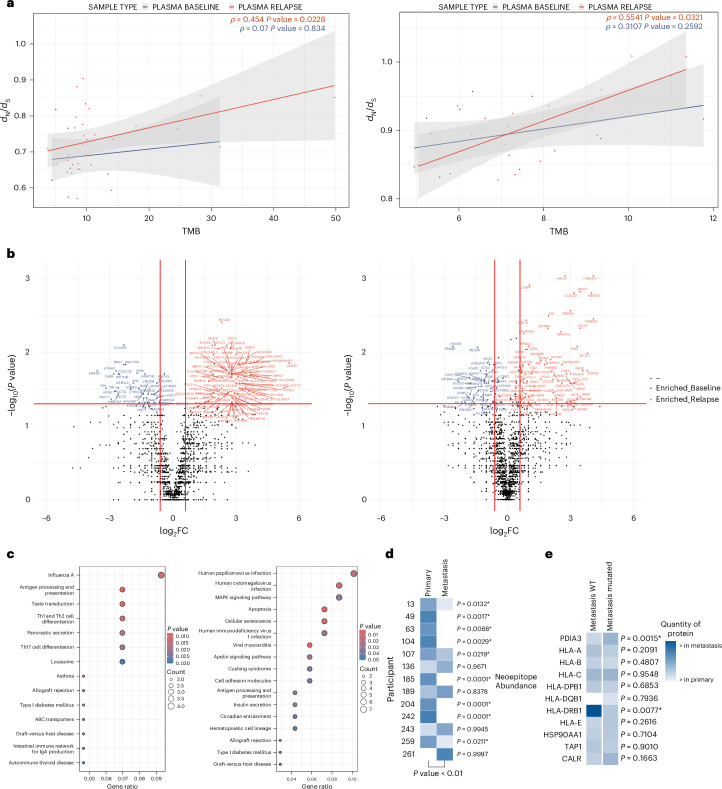
In stage 2-3 colon cancer (CC), postsurgery circulating tumor DNA (ctDNA) assessment is crucial for guiding adjuvant chemotherapy (ACT) decisions. While existing assays detect ctDNA and help identify high-risk persons with CC for recurrence, their limited sensitivity after surgery poses challenges in deciding on ACT. Additionally, a substantial portion of persons with CC fail to clear ctDNA after ACT, leading to recurrence. In this study, we performed whole-exome sequencing (WES) of ctDNA at different time points in participants with relapsed CC in two independent cohorts, alongside transcriptomic and proteomic analyses of metastases, to enhance comprehension of progression mechanisms. A plasma WES-based tumor-agnostic assay demonstrated higher sensitivity in detecting minimal residual disease (MRD) compared to current assays. Immune evasion appears to be the primary driver of progression in the localized CC setting, indicating the potential efficacy of immunotherapy for microsatellite stability in persons with CC. Organoid modeling further supports the promising potential of targeted therapy in eradicating MRD, surpassing conventional treatments.


Conflict of interest statement

Competing interests: A.C. declares institutional research funding from Genentech, Merck Serono, BMS, MSD, Roche, Beigene, Bayer, Servier, Lilly, Natera, Novartis, Takeda, Astellas and Fibrogen and advisory board or speaker fees from Merck Serono, Roche, Servier, Takeda and Astellas. N.T. declares advisory board or speaker fees from Merck Serono, Servier, Pfizer, Natera and Guardant Health. M.H. declares advisory board and speaker fees from Servier. T.F. declares institutional research funding from Genentech, Adapt Immune, Roche, Beigene, Astelas, BMS, Daichii Sanyo and Amgen and speaker fees from Astrazeneca, Amgen, Bayer, BMS, Lilly, MSD and Servier. V.G. declares advisory board fees from Boehringer Ingelheim and institutional research funding from Bayer, Boehringer, Roche, Genentech, Merck Serono, Beigene, Servier, Lilly, Novartis, Takeda, Astelas, Fibrogen, Amcure, Natera, Sierra Oncology, AstraZeneca, Medimmune, BMS and MSD. S.R. declares personal fees as an invited speaker from Amgen, MSD and Servier, advisory board fees from Amgen, Servier and Sirtex and institutional funding from Ability Pharmaceuticals, Astellas, G1 Therapeutics, Hutchinson, Menarini, Mirati, Novartis, Pfizer, Pierre Fabre, Roche and Seagen. C.L.A. declares institutional research funding from Natera, C2i Genomics and BioRad Laboratories. V.P.M. reports consultancy for Johnson&Johnson and Baxter, has received honorarium for speaking at symposia and workshops by Johnson&Johnson, Medtronic and Braun Medical and has received support for attending meetings by Takeda. J. Martín-Arévalo reports consultancy for Baxter and has received honorarium for speaking at workshops by Johnson&Johnson and Medtronic. D.M. has received honorarium for speaking at symposia and workshops by Johnson&Johnson and Medtronic and support for attending meetings by Sanofi. S.G.-B., A.E. and L.P.-S. have received honorarium for educational courses by Johnson&Johnson, Marina Garcés Albir and Dixie Huntley. C.M.-C. declares advisory board or speaker fees from MSD, Astelas and BMS. The other authors declare no competing interests.

Figures

Fig. 1
Fig. 1. CONSORT diagram.
CONSORT diagram illustrating the enrolled cohort, detailing the different participant subgroups and sample collections at various time points, including baseline, postoperative and relapse stages. The discovery cohort is divided into relapse and nonrelapse participants, with associated tumor tissue and plasma samples analyzed for molecular characterization. PDOs were included as models on the basis of their molecular similarity to the discovery cohort. The validation cohort follows a similar structure, serving to confirm findings from the discovery cohort. The diagram also highlights the clinical inquiries addressed in the study.
Fig. 2
Fig. 2. Study design.
Schematic representation illustrating the study workflow, depicting the analysis of ctDNA from plasma samples collected at different time points: baseline (pretreatment), postoperative and relapse stages. The figure highlights the transition of molecular alterations over time, represented by changes in the composition and abundance of mutations. A density plot visualizes the distribution and evolution of these alterations across different stages. PDOs were not sourced from participants within the discovery cohort; rather, they were selected as models on the basis of their molecular similarity to the participants in this cohort. Created with BioRender.com.
Fig. 3
Fig. 3. Comparison and concordance of molecular landscape in matched tissue and plasma samples.
a, Comparative molecular landscape of pathogenic mutations and CNVs in paired tissue and plasma baseline samples from 12 participants with CC. Each box represents a mutated gene in a specific participant, divided into two parts. Left, results from the primary tumor. Right, results from plasma at baseline. Additionally, each box at a given collection moment is further divided into two parts. Left, point mutations. Right, CNVs. The y axis is organized by the number of point mutations for each gene across all participants. b, Percentage of concordance in somatic SNVs between primary tumor and plasma at baseline (n = 12 participants) and at relapse (n = 17 participants) in the participant cohort. Data are presented as the median values ± s.d. Concordance was determined by comparing each participant to themself at different stages. c, Percentage of concordance in CNVs between primary tumor and plasma at baseline (n = 12) and at relapse (n = 17 participants) across the participant cohort. Data are presented as the median values ± s.d. Similar to SNVs, concordance was calculated by comparing each participant to themself at different stages. d, Functional enrichment analysis based on REACTOME (n = 12 participants). Left, enriched signatures in genes with CNV loss in plasma compared to the primary tumor at baseline. Right, enriched signatures in genes with CNV gains in plasma relative to tissue. The gray bar corresponds to the −log(FDR) and the green line represents the number of genes overlapping in each REACTOME term. Source data
Fig. 4
Fig. 4. Tumor evolution.
a, Comparative molecular profiling of pathogenic mutations and CNVs in paired plasma baseline and relapse samples from 12 participants with CC. Each box signifies a mutated gene in an individual participant, with division into two parts separated by a line. Left, results obtained at baseline. Right, results from plasma at relapse. Similarly, each box corresponding to a collection moment is subdivided into two components. Left, point mutations. Right, CNVs. The y axis is organized on the basis of the number of point mutations for each gene across all participants. b, Evolutionary plot in the discovery cohort for seven paired participants (top) and the validation cohort for 14 paired participants (bottom), illustrating somatic mutations occurring at baseline, after surgery and at relapse. Colors indicate the presence of mutations over time, with gray representing mutations appearing at baseline but representing unselected subclones lost after surgery. The indications of the sampling time points are not drawn to time scale. Moving along the chromatic scale from green to purple signifies mutations persisting over time and considered clonal. Mutations emerging after surgery until relapse are represented in shades of red, indicating clones arising during tumor evolution in this period. Right, upset plot indicating the correspondence of colors with temporal points where the mutation was found. c, Spearman correlation (n = 7 participants; two-sided) between the B cell infiltration and mutational concordance between baseline and relapse plasma in the discovery cohort. Left, correlation between infiltrated B lymphocytes using RNA-seq deconvolution through the CIBERSORT pipeline versus the mutational concordance. Right, correlation of the intensity of CD20 positivity by IHC in the primary tissues versus mutational concordance. Representative images of some of the participants from CD20 IHC on the primary tissues are indicated. Colors are included for each of the different participants (points) to allow comparison to the validation data using IHC with CD20. The line represents the fitted relationship between the variables, while the shaded band corresponds to the 95% confidence interval around the regression estimate. d, Functional enrichment analysis by hallmark gene sets revealed enriched pathways in mutated genes in the discovery cohort (top; n = 7 participants) and the validation cohort (bottom; n = 14 participants). A one-sided hypergeometric test was used to assess whether the input gene set was significantly overrepresented in hallmark gene sets compared to a background set of genes. The P values were adjusted for multiple comparisons using the FDR correction, with a significance threshold of 0.05. Source data
Fig. 5
Fig. 5. Analysis of parallel evolution.
a, Spearman correlation (two-sided) between TMB and dN/dS in plasma at both baseline and relapse in the discovery cohort (left; n = 12) and the validation cohort (right; n = 15 participants). The P and ρ values are provided for each case. The line represents the fitted relationship between the variables, while the shaded band corresponds to the 95% confidence interval around the regression estimate. b, Volcano plot in the discovery cohort (left; n = 12 participants) and the validation cohort (right; n = 15 participants) illustrating genes significantly associated with a higher number of somatic mutations at relapse and baseline. The P-value threshold was set at 0.05 and the log2(fold change) range was between −0.6 and 0.6 (two-sided Wilcoxon test). The P values were adjusted for multiple comparisons using the FDR correction, with a significance threshold of 0.05. c, Functional enrichment analysis of all significant genes exhibiting a higher number of somatic mutations at relapse compared to the baseline stage in the discovery cohort (left; n = 12 participants) and the validation cohort (right; n = 15 participants). A one-sided hypergeometric test was used to assess whether the input gene set was significantly overrepresented in KEGG pathways compared to a background set of genes. The P values were adjusted for multiple comparisons using the FDR correction, with a significance threshold of 0.05. d, Comparative quantification of neoepitope abundance between paired metastatic and primary tumor samples (n = 13 participants). An asterisk denotes a statistically significant difference (P < 0.05) in neoepitope abundance between primary and metastatic tissues, as determined by a one-sided t-test. The analysis was based on the hypothesis that metastatic tissues exhibit a lower neoepitope abundance than primary tumors. The P value for the overall comparison between primary and metastatic tumors was <0.001. Individual P values for each participant were as follows: participant 13, 0.0132; participant 49, 0.0017; participant 63, 0.0068; participant 104, 0.0029; participant 107, 0.0219; participant 136, 0.9671; participant 185, 0.0001; participant 189, 0.8378; participant 204, 0.0001; participant 242, 0.0001; participant 243, 0.9945; participant 259, 0.0211; participant 261, 0.9997. e, Median protein quantification ratio of wild-type versus mutated metastasis samples identified by MS (n = 14 participants). The asterisk indicates a significant difference in protein ratio between primary and metastatic tissues based on the presence of the mutation at relapse according to a two-sided t-test analysis. Individual P values were as follows: PDIA3, 0.0014; HLA-A, 0.2091; HLA-B, 0.4807; HLA-C, 0.9548; HLA-DPB1, 0.6853; HLA-DQB1, 0.7936; HLA-DRB1, 0.0077; HLA-E, 0.2616; HSP90AA1, 0.7104; TAP1, 0.9010; CALR, 0.1663). Source data
Extended Data Fig. 1
Extended Data Fig. 1. Molecular profiling of paired tissue and plasma comparison at baseline in the validation cohort.
a, Concordance analysis of primary tumor and plasma baseline somatic SNVs. The cohort’s median concordance is represented by a dot. b, Comparative molecular landscape of pathogenic mutations and CNV in paired tissue and plasma samples at baseline from 15 colorectal cancer CC patients. Each box illustrates a mutated gene in a specific patient, divided into two sections: the left section displays results from the primary tissue, and the right section depicts plasma at baseline. Similarly, each box at a given collection moment is subdivided into two parts, with the left indicating point mutations, and the right representing CNVs. The Y-axis is arranged by the number of point mutations for each gene across all patients. Source data
Extended Data Fig. 2
Extended Data Fig. 2. Molecular landscape of the paired tissue-plasma comparison at relapse.
Comparative analysis of the molecular landscape, focusing on pathogenic mutations and CNVs, in paired tissue and plasma samples collected at the point of relapse from 17 CC patients. Each box within the representation signifies a mutated gene in an individual patient, and it is divided into two sections by a line. The left part corresponds to outcomes derived from the metastatic tissue, while the right part corresponds to plasma at the time of relapse. Similarly, each box corresponding to a collection moment is further divided into two components, with the left indicating point mutations, and the right representing CNVs. The Y-axis is arranged based on the number of point mutations for each gene across all patients. Source data
Extended Data Fig. 3
Extended Data Fig. 3. Minimal residual disease concordance of candidate variants.
Median concordance of candidate variants when selecting the 16 somatic mutations with the highest VAF for MRD monitoring in primary tumor and plasma baseline samples within the discovery cohort (left, n = 12 patients) and the validation cohort (right, n = 14 patients). Two-sided Wilcoxon test; p-value = 0.047. Source data
Extended Data Fig. 4
Extended Data Fig. 4. Molecular profiling of tumor evolution comparing plasma at both baseline and relapse in the validation cohort.
Comparative molecular landscape of somatic pathogenic mutations and CNVs in paired plasma samples at baseline and relapse from 15 CC patients. Each box within the representation signifies a mutated gene in an individual patient, divided into two sections by a line. The left segment corresponds to outcomes obtained in the plasma baseline, while the right segment corresponds to plasma at relapse. Similarly, each box corresponding to a collection moment is further divided into two components, with the left indicating point mutations and the right representing CNVs. The Y-axis is organized based on the number of point mutations for each gene across all patients. Source data
Extended Data Fig. 5
Extended Data Fig. 5. Molecular landscape of the tumor evolution comparing tissue at baseline and plasma at relapse.
a, Comparative molecular profiling of pathogenic mutations and CNVs in paired tissue at baseline and plasma at relapse samples from 25 CC patients. Each box in the illustration denotes a mutated gene in an individual patient, bifurcated into two sections by a line. The left segment corresponds to findings derived from the primary tumor, while the right segment corresponds to plasma at relapse. Similarly, each box associated with a specific collection moment is further divided into two components: the left portion denotes point mutations, and the right portion represents CNVs. The Y-axis is organized based on the number of point mutations for each gene across all patients. b, Concordance comparison between the primary tumor and plasma at relapse (n = 25 patients) versus the concordance of plasma at both baseline and relapse (n = 12 patients) of somatic mutations across the discovery cohort (two-sided Wilcoxon test; p-value = 0.0015). Data are presented as median values +/- standard deviation. Concordance is calculated by comparing each patient with themselves at different stages. Source data
Extended Data Fig. 6
Extended Data Fig. 6. Analysis of tumor evolution.
Evolutionary plot per patient in the a, discovery cohort (n = 7) and b, validation cohort (n = 14) illustrating somatic mutations occurring at baseline, post-surgery, and at relapse. The y-axis represents the accumulated number of mutations across the cohort. The presence of mutations over time is depicted by colors, where gray indicates mutations appearing at baseline but representing unselected subclones lost after surgery. Progressing up the chromatic scale from green to purple signifies mutations persisting over time, considered clonal. Conversely, mutations emerging after surgery until the patient’s relapse are depicted in shades of red, indicating clones arising due to tumor evolution during this period. c, EMT scores for metastatic and primary tissues. Distribution of EMT scores for primary tissues and metastatic tissues for each patient. Negative scores can be interpreted as indicating a mesenchymal phenotype, whereas positive scores indicate an epithelial phenotype. Source data
Extended Data Fig. 7
Extended Data Fig. 7. Mutational signatures in the discovery cohort.
a, Identification of mutational signatures at relapse (n = 25 patients). Each bar represents an individual patient, with colors corresponding to different mutational signatures, as indicated in the legend. The upper panel provides patient metadata, including age, batch, tumor location, gender, MSI status, and stage. b, Comparative distribution of mutational signatures between plasma at both baseline and relapse (n = 12 patients). The distribution of mutational signatures at both time points is displayed, allowing visualization of changes in signature composition over time. Each bar represents an individual patient, with colors corresponding to different mutational signatures, as indicated in the legend. The upper panel provides patient metadata, including age, batch, tumor location, gender, MSI status, and stage. Source data
Extended Data Fig. 8
Extended Data Fig. 8. Evaluation of TMB.
a, TMB comparison between tissue samples at baseline and relapse in the discovery cohort (n = 17; two-sided Wilcoxon test; p-value = 0.7910). The minimum values are the smallest number of TMB of the cohort. The first quartile above the whiskers represents the data point that separates the lowest 25% of the data from the rest. The center line per box plot represents the median value among the data points. The third quartile just on top of the box plot separates the lowest 75% of the data points from the highest 25%. The maximum value represents the highest TMB of the cohort. b, TMB comparison between plasma samples at both baseline and relapse in the discovery cohort (n = 12; two-sided Wilcoxon test; p-value = 0.9632). The minimum values are the smallest number of TMB of the cohort. The first quartile above the whiskers represents the data point that separates the lowest 25% of the data from the rest. The center line per box plot represents the median value among the data points. The third quartile just on top of the box plot separates the lowest 75% of the data points from the highest 25%. The maximum value represents the highest TMB of the cohort. c, TMB comparison between plasma samples at both baseline and relapse in the validation cohort (n = 15; two-sided Wilcoxon test; p-value = 0.1070). Each patient is individually compared across different stages. The minimum values are the smallest number of TMB of the cohort. The first quartile above the whiskers represents the data point that separates the lowest 25% of the data from the rest. The center line per box plot represents the median value among the data points. The third quartile just on top of the box plot separates the lowest 75% of the data points from the highest 25%. The maximum value represents the highest TMB of the cohort. d, Spearman correlation (two-sided) analysis between TMB and dN/dS in primary tissue (blue; n = 25; p-value = 0.0785) and relapse (red; n = 17; p-value = 0.0199) within the discovery cohort. P-values and rho scores are reported for each case. The line represents the fitted relationship between the variables, while the shaded band corresponds to the 95% confidence interval around the regression estimate. Source data
Extended Data Fig. 9
Extended Data Fig. 9. Drug screening in PDOs models.
a. Dendrogram derived from hierarchical clustering to identify PDOs exhibiting molecular similarity to patients within our cohort. b, Landscape of actionable genes identified in each selected PDO model and their corresponding CC patient from the discovery cohort. c, Heatmap of Log-AUCs illustrating the responsiveness of three PDO models to various targeted therapies and conventional chemotherapy agents (dark shading indicating a favorable response, clear shading indicating no response). The left panel presents the actionable mutations identified in each PDO. For every PDO drug sensitivity assay, three biological replicates with three technical replicates each, were performed for each condition analyzed. d, Logarithmically transformed dose-response curves depicting the viability of PDO models (CTO65, CTO119, and CTO147) in response to escalating doses of standard chemotherapy agents and targeted therapy drugs. For every PDO drug sensitivity assay, three biological replicates with three technical replicates each, were performed for each condition analyzed. Data are presented as median values +/- standard deviation. Source data
Extended Data Fig. 10
Extended Data Fig. 10. Comparison of sequencing statistics between the discovery and validation cohorts.
a, Sequencing coverage. The minimum values are the smallest number of coverage of the cohort. The first quartile above the whiskers represents the data point that separates the lowest 25% of the data from the rest. The center line per box plot represents the median value among the data points. The third quartile just on top of the box plot separates the lowest 75% of the data points from the highest 25%. The maximum value represents the highest coverage of the cohort. Two-sided Wilcoxon test; p-value: WBCs=7.8e-06; tissue=0.016; baseline plasma (PLASMA-BL) = 2.0e-05; post-operative plasma (PLASMA-PO) = 2.6e-08; relapse plasma (PLASMA) = 2.7e-07. b, Tumor fraction. The minimum values are the smallest number of tumor fraction of the cohort. The first quartile above the whiskers represents the data point that separates the lowest 25% of the data from the rest. The center line per box plot represents the median value among the data points. The third quartile just on top of the box plot separates the lowest 75% of the data points from the highest 25%. The maximum value represents the highest tumor fraction of the cohort. Two-sided Wilcoxon test; p-value: baseline plasma (PLASMA-BL) = 0.139; post-operative plasma (PLASMA-PO) = 0.014; relapse plasma (PLASMA) = 0.026. c, Tumor mutational burden. The minimum values are the smallest number of TMB of the cohort. The first quartile above the whiskers represents the data point that separates the lowest 25% of the data from the rest. The center line per box plot represents the median value among the data points. The third quartile just on top of the box plot separates the lowest 75% of the data points from the highest 25%. The maximum value represents the highest TMB of the cohort. Two-sided Wilcoxon test; p-value: baseline tissue=0.111; baseline plasma=0.318; post-operative plasma (PLASMA-PO) = 0.018; relapse plasma=0.074. Source data

References

    1. Argilés, G. et al. Localised colon cancer: ESMO Clinical Practice Guidelines for diagnosis, treatment and follow-up. Ann. Oncol.31, 1291–1305 (2020). - PubMed
    1. Tie, J. et al. Circulating tumor DNA analysis detects minimal residual disease and predicts recurrence in patients with stage II colon cancer. Sci. Transl. Med.8, 346ra392 (2016). - PMC - PubMed
    1. Reinert, T. et al. Analysis of plasma cell-free DNA by ultradeep sequencing in patients with stages I to III colorectal cancer. JAMA Oncol.5, 1124–1131 (2019). - PMC - PubMed
    1. Tie, J. et al. Circulating tumor DNA analyses as markers of recurrence risk and benefit of adjuvant therapy for stage III colon cancer. JAMA Oncol.5, 1710–1717 (2019). - PMC - PubMed
    1. Tarazona, N. et al. Targeted next-generation sequencing of circulating-tumor DNA for tracking minimal residual disease in localized colon cancer. Ann. Oncol.30, 1804–1812 (2019). - PubMed

MeSH terms

LinkOut - more resources