

Transcriptome landscape of the adrenal gland and superior cervical ganglion from hypertension-induced left ventricular hypertrophy rat model
- PMID: 40301730
- PMCID: PMC12039094
- DOI: 10.1186/s12864-025-11559-0
Transcriptome landscape of the adrenal gland and superior cervical ganglion from hypertension-induced left ventricular hypertrophy rat model
Abstract
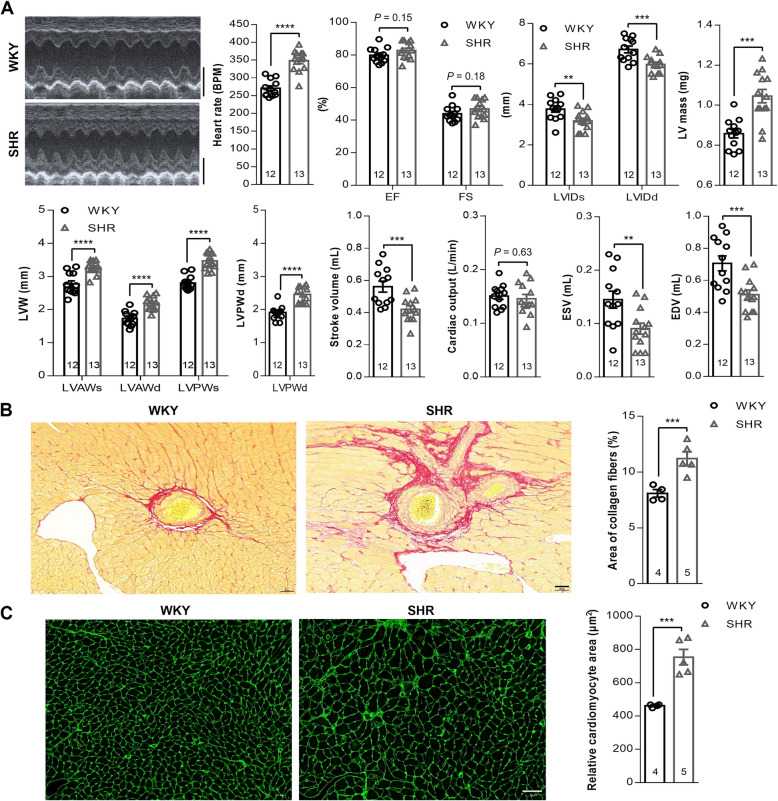
Background: Hypertension-induced left ventricular hypertrophy (LVH) is a cardiac structural remodeling and dysfunction resulting from chronic hypertension and is an independent risk factor for cardiovascular morbidity and mortality. Studies have implicated the involvement of the adrenal gland (AG) and superior cervical ganglion (SCG) in hypertension regulation. However, the molecular mechanisms of AG and SCG during hypertension-induced LVH remain unclear. In this study, we investigated the transcriptome characteristics of the left ventricle, AG, and SCG in 24-week-old spontaneously hypertensive rats (SHR) and Wistar-Kyoto (WKY) rats using transcriptome sequencing (RNA-seq) technology.
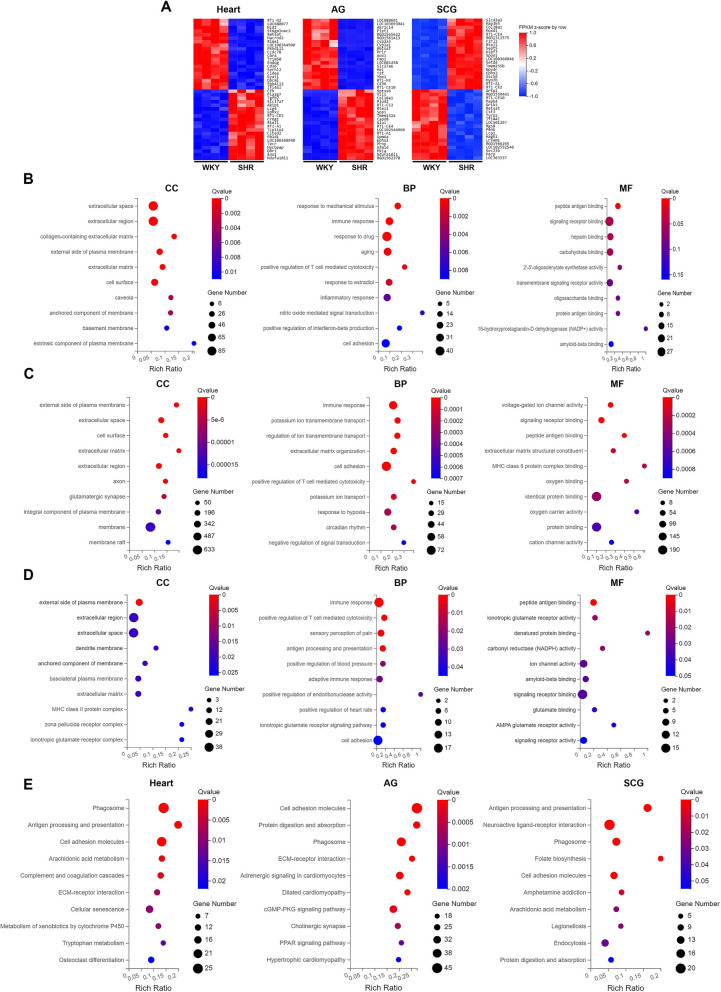
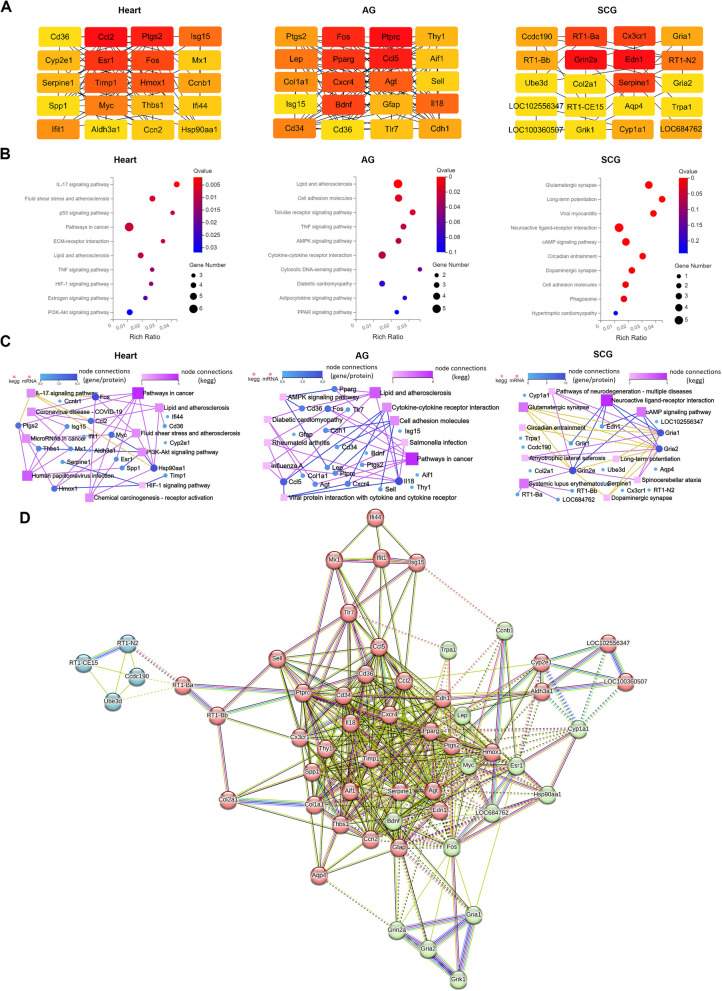
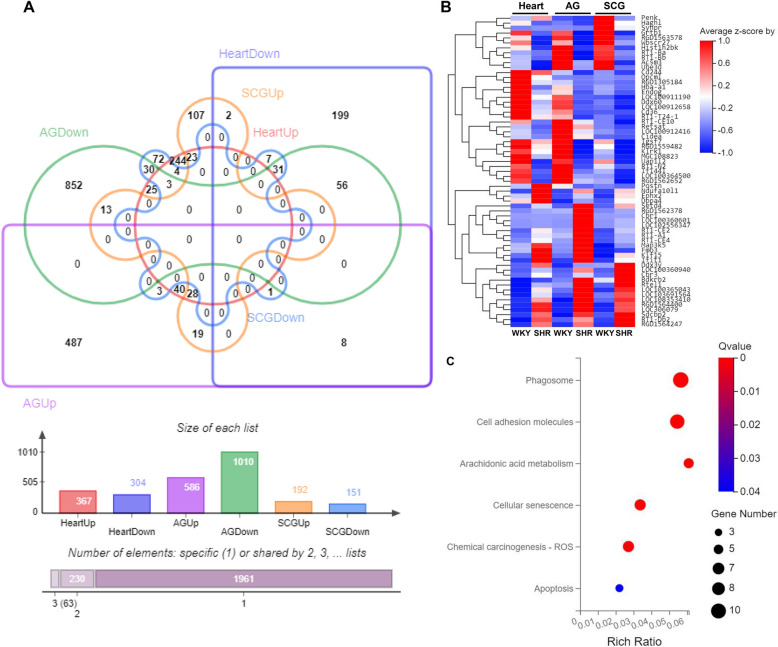
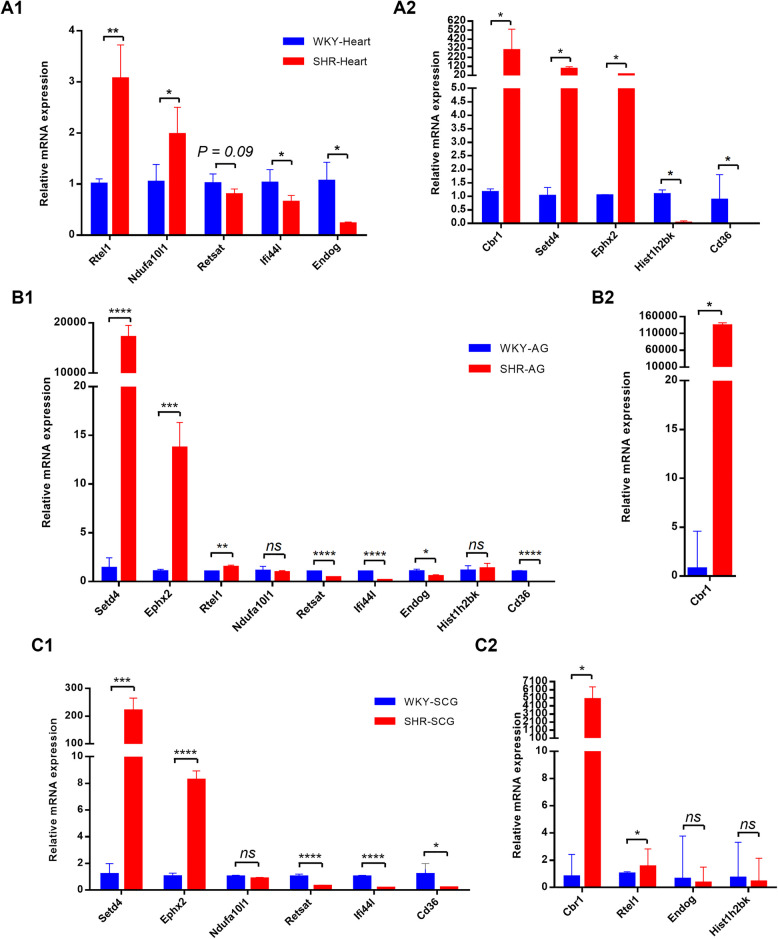
Results: We identified 671 differentially expressed genes (DEGs) in the left ventricle, 1596 DEGs in the AG, and 343 DEGs in the SCG between SHR and WKY rats. Functional analysis revealed that these DEGs were involved in pathways related to immune inflammation, cellular senescence, metabolic responses, and synaptic transmission. We also identified the top 20 hub genes specific to each of the three organs. PPI network analysis showed that these hub genes were highly interconnected and clustered into three functional modules. KEGG pathway analysis revealed that the hub genes in the left ventricle and AG were mainly enriched in inflammation-related pathways, while the hub genes in the SCG were primarily enriched in synapse-related pathways. Venn diagram analysis identified 63 overlapping DEGs across the three organs, with 59 DEGs exhibiting consistent expression changes.
Conclusions: In summary, our study elucidates the transcriptome features of AG and SCG during hypertension-induced LVH in SHR.
Keywords: Adrenal gland; Hypertension; Left ventricular hypertrophy; RNA-seq; Superior cervical ganglion.
© 2025. The Author(s).
Conflict of interest statement
Declarations. Ethics approval and consent to participate: All procedures performed in this study were in accordance with national animal research regulations, and all animal experimental protocols complied with the ARRIVE guidelines and were approved by the Institutional Animal Ethics Committee of Chongqing Medical University (approval number: IACUC-CQMU-2023-12059). No human studies are presented in this manuscript. No potentially identifiable human images or data is presented in this study. Consent for publication: Not applicable. Competing interests: The authors declare no competing interests.
Figures
Similar articles
-
Identification of immune-related genes and small-molecule drugs in hypertension-induced left ventricular hypertrophy based on machine learning algorithms and molecular docking.Front Immunol. 2024 Jun 27;15:1351945. doi: 10.3389/fimmu.2024.1351945. eCollection 2024. Front Immunol. 2024. PMID: 38994368 Free PMC article.
-
Metabolic Changes in Spontaneously Hypertensive Rat Hearts Precede Cardiac Dysfunction and Left Ventricular Hypertrophy.J Am Heart Assoc. 2019 Feb 19;8(4):e010926. doi: 10.1161/JAHA.118.010926. J Am Heart Assoc. 2019. PMID: 30764689 Free PMC article.
-
Transcriptional alterations in the left ventricle of three hypertensive rat models.Physiol Genomics. 2006 Nov 27;27(3):295-308. doi: 10.1152/physiolgenomics.00318.2005. Epub 2006 Aug 1. Physiol Genomics. 2006. PMID: 16882881
-
Reduction of prohibitin expression contributes to left ventricular hypertrophy via enhancement of mitochondrial reactive oxygen species formation in spontaneous hypertensive rats.Free Radic Res. 2015 Feb;49(2):164-74. doi: 10.3109/10715762.2014.991724. Epub 2014 Dec 22. Free Radic Res. 2015. PMID: 25465279
-
Compromised mitochondrial remodeling in compensatory hypertrophied myocardium of spontaneously hypertensive rat.Cardiovasc Pathol. 2014 Mar-Apr;23(2):101-6. doi: 10.1016/j.carpath.2013.11.002. Epub 2013 Nov 14. Cardiovasc Pathol. 2014. PMID: 24388463
References
-
- Messerli FH, Rimoldi SF, Bangalore S. The Transition from Hypertension to Heart Failure: Contemporary Update. JACC Heart Fail. 2017;5(8):543–51. 10.1016/j.jchf.2017.04.012 - PubMed
-
- Wu X, Yang F, Sun L. Computed tomography myocardial perfusion imaging of patients with left ventricular hypertrophy in hypertension: A retrospective study. Clin Exp Hypertens. 2023;45(1):2159426. 10.1080/10641963.2022.2159426 - PubMed
-
- Saba PS, Cameli M, Casalnuovo G, Ciccone MM, Ganau A, Maiello M, Modesti PA, Muiesan ML, Novo S, Palmiero P, Sanna GD, Scicchitano P, Pedrinelli R; Gruppo di Studio Ipertensione, Prevenzione e Riabilitazione, Società Italiana di Cardiologia. Ventricular-vascular coupling in hypertension: methodological considerations and clinical implications. J Cardiovasc Med (Hagerstown). 2014;15(11):773–787. 10.2459/JCM.0000000000000146 - PubMed
MeSH terms
Grants and funding
LinkOut - more resources
Full Text Sources
Medical
