

A comparison of quantitative and semi-quantitative methods for assessing cartilage status and change over time; data from the osteoarthritis initiative
- PMID: 40301834
- PMCID: PMC12042560
- DOI: 10.1186/s12891-025-08501-6
A comparison of quantitative and semi-quantitative methods for assessing cartilage status and change over time; data from the osteoarthritis initiative
Abstract
Introduction: The aim of this study was to compare the cross-sectional relationship and longitudinal responsiveness of the semi-quantitative MRI Osteoarthritis Knee Score (MOAKS) with automated quantitative cartilage thickness measures.
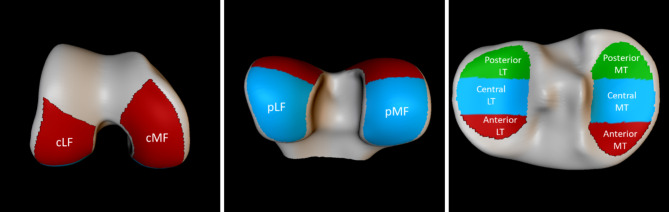
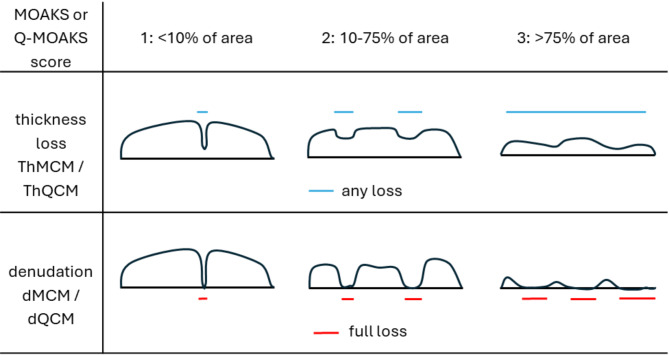
Methods: Images and MOAKS scores from 297 participants with evidence of radiographic progression (groups 1 and 2) from the OAI FNIH sub-cohort were included. To facilitate direct comparison, novel quantitative measures of cartilage loss (termed Q-MOAKS) were matched to MOAKS regions. Mean normative cartilage thickness was computed for each subregion using OAI non-OA controls. The Q-MOAKS thickness loss score was based on the proportion of cartilage thickness over a subregion that was < 95% normative thickness, the denudation score was based on < 5% normative thickness. Q-MOAKS area proportions were categorised into scores as for MOAKS. Quantitative cartilage thickness (ThCtAB) was also measured in MOAKS subregions. We compared MOAKS against Q-MOAKS and ThCtAB cross-sectionally using Spearman's rank correlation and descriptive statistics including proportions and boxplots. Longitudinally, responsiveness was assessed at 1 and 2 years using standardised response means (SRM).
Results: Cross-sectionally, there was a poor correlation between MOAKS and Q-MOAKS thickness loss and denudation scores in all regions except central medial femur (cMF) and tibia (cMT) with moderate correlation for thickness loss scores: cMF, ρ = 0.59, (95%CI:0.51, 0.66) cMT, ρ = 0.58, (0.50, 0.65). In cMF, despite the broad range for the MOAKS thickness loss score = 2 (10-75% region surface area), only 56% (89/159) of knees were Q-MOAKS = 2 and 23% of MOAKS denudation = 2 were represented in Q-MOAKS = 2. In cMT, the results for similar comparisons were 61% and 66% respectively. MOAKS appeared to overestimate grades 2 and 3. Over 2-year follow-up MOAKS thickness loss and denudation scores were less responsive than Q-MOAKS in most subregions. MOAKS thickness loss was most responsive in cMT (SRM = 0.47, (95%CI:0.41, 0.54)). ThCtAB was substantially more responsive: SRM=-0.84, (-0.96, -0.73) in this region.
Conclusion: Though MOAKS status scores showed reasonable correlation with quantitative measures of thickness in medial compartments, concordance between MOAKS and quantitative cartilage area loss was poor. Quantitative measures of thickness loss were substantially more responsive then MOAKS scores over a 1 and 2-year period.
Keywords: Cartilage; Denudation; MOAKS; MRI; Osteoarthritis; Quantitative; Scoring; Semi-quantitative; Thickness.
© 2025. The Author(s).
Conflict of interest statement
Declarations. Ethics approval and consent to participate: Institutional review boards at all OAI clinical sites and coordinating centre (Memorial Hospital of Rhode Island Institutional Review Board, The Ohio State University’s Biomedical Sciences Institutional Review Board, University of Pittsburgh Institutional Review Board, and University of Maryland Baltimore – Institutional Review Board, and Committee on Human Research at University of California, San Francisco; Approval Number: 10–00532) approved the study. The OAI has been approved and meets all criteria for ethical standards regarding human and animal studies defined in the 1964 Declaration of Helsinki and all amendments made after. All participants provided written informed consent prior to participation. Consent for publication: Not applicable. Competing interests: MAB and ADB are employees of Imorphics, a wholly owned subsidiary of Stryker Corporation. AR, BD and ER have no conflicts of interest to disclose. PGC has done consultancies or speakers bureaus for AbbVie, Bristol Myers Squibb, Eli Lilly, EMD Serono, Flexion Therapeutics, Galapagos, GlaxoSmithKline, Novartis, Pfizer, Roche, Samumed, and Stryker.
Figures

Similar articles
-
Selection of Knees With Subsequent Cartilage Thickness Loss Based on Magnetic Resonance Imaging Semiquantitative Grading: Data From the Osteoarthritis Initiative Foundation for the National Institutes of Health Biomarker Cohort.Arthritis Care Res (Hoboken). 2023 Aug;75(8):1773-1782. doi: 10.1002/acr.25078. Epub 2023 Feb 22. Arthritis Care Res (Hoboken). 2023. PMID: 36576026
-
How to define subregional osteoarthritis progression using semi-quantitative MRI osteoarthritis knee score (MOAKS).Osteoarthritis Cartilage. 2014 Oct;22(10):1533-6. doi: 10.1016/j.joca.2014.06.022. Osteoarthritis Cartilage. 2014. PMID: 25278062
-
Precision, Reliability, and Responsiveness of a Novel Automated Quantification Tool for Cartilage Thickness: Data from the Osteoarthritis Initiative.J Rheumatol. 2020 Feb;47(2):282-289. doi: 10.3899/jrheum.180541. Epub 2019 Apr 15. J Rheumatol. 2020. PMID: 30988122
-
Magnetic resonance imaging (MRI) of articular cartilage in knee osteoarthritis (OA): morphological assessment.Osteoarthritis Cartilage. 2006;14 Suppl A:A46-75. doi: 10.1016/j.joca.2006.02.026. Epub 2006 May 19. Osteoarthritis Cartilage. 2006. PMID: 16713720 Review.
-
Responsiveness and reliability of MRI in knee osteoarthritis: a meta-analysis of published evidence.Osteoarthritis Cartilage. 2011 May;19(5):589-605. doi: 10.1016/j.joca.2010.10.030. Epub 2011 Mar 23. Osteoarthritis Cartilage. 2011. PMID: 21396465 Free PMC article. Review.
References
-
- Eckstein F, Cicuttini F, Raynauld JP, Waterton JC, Peterfy C. Magnetic resonance imaging (MRI) of articular cartilage in knee osteoarthritis (OA): morphological assessment. Osteoarthr Cartil. 2006;14:46–75. 10.1016/j.joca.2006.02.026. no. SUPPL. 1. - PubMed
-
- Brett A et al. Nov., Automated MRI assessment confirms cartilage thickness modification in patients with knee osteoarthritis: post-hoc analysis from a phase II sprifermin study, Osteoarthr. Cartil., vol. 28, no. 11, pp. 1432–1436, 2020, 10.1016/j.joca.2020.08.005 - PubMed
Publication types
MeSH terms
Grants and funding
- 21595/Centre for Sport, Exercise and Osteoarthritis Research Versus Arthritis, United Kingdom
- 21595/Centre for Sport, Exercise and Osteoarthritis Research Versus Arthritis, United Kingdom
- 21595/Centre for Sport, Exercise and Osteoarthritis Research Versus Arthritis, United Kingdom
- EP/P001076/1/EPSRC
- EP/P001076/1/EPSRC
LinkOut - more resources
Full Text Sources
Medical
